Visualize any data in charts people trust.
Official world figures built in, the source under every chart.
No account needed to try.
Every chart type
See all examples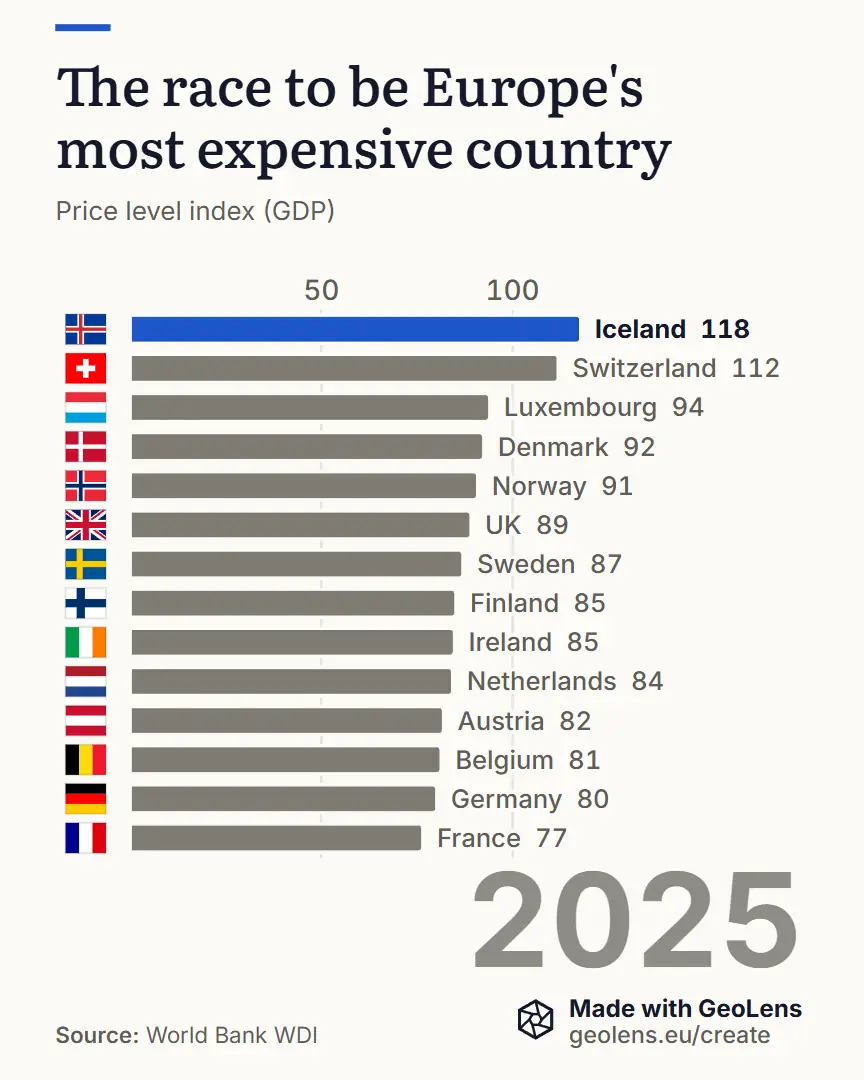
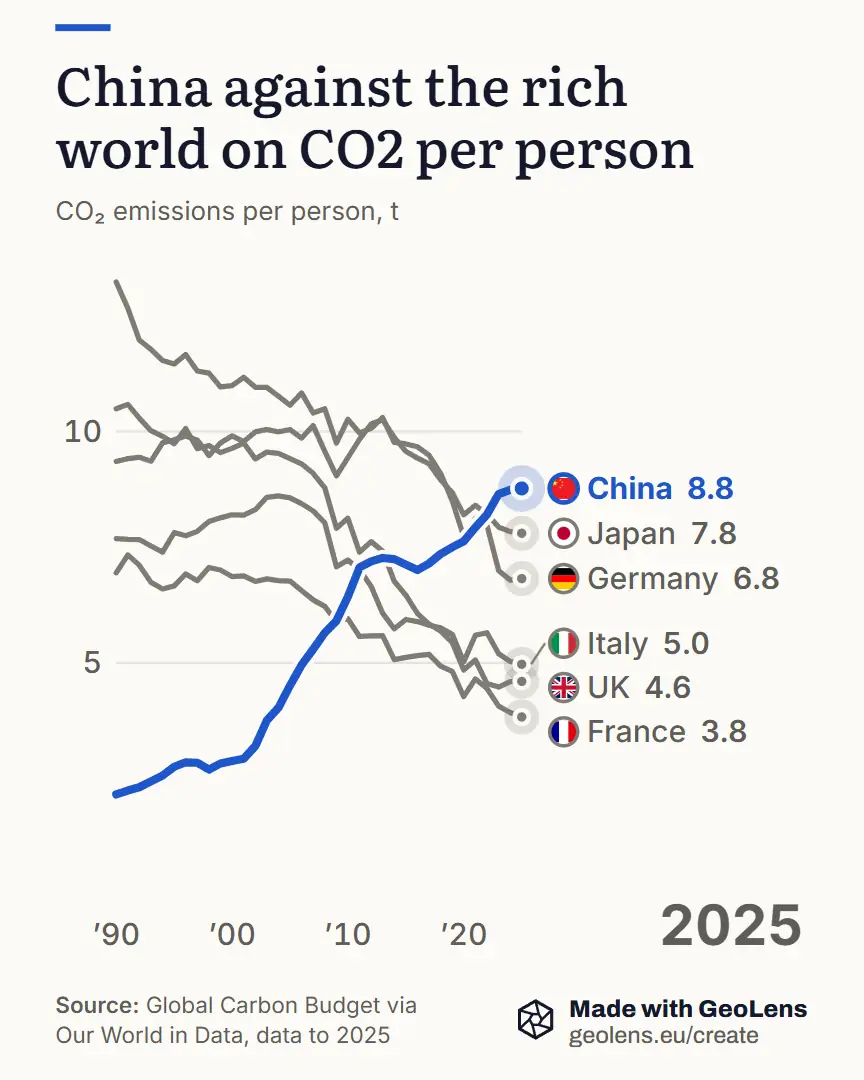
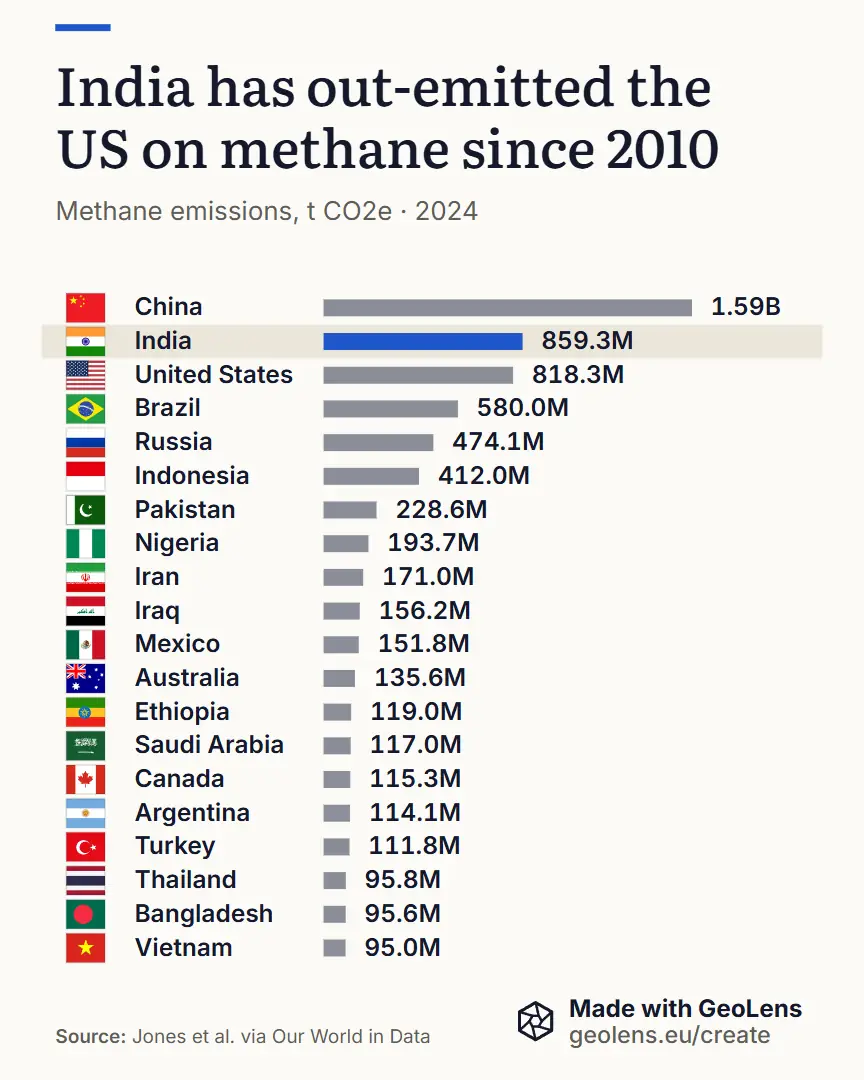
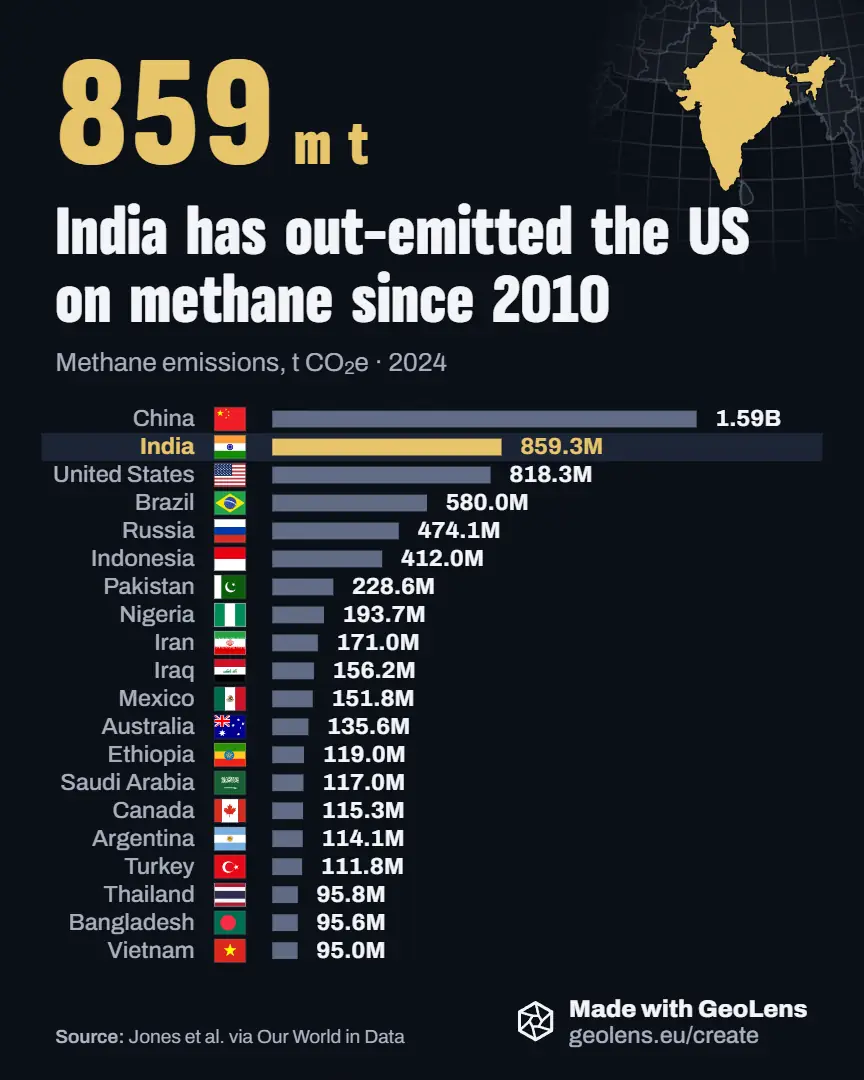
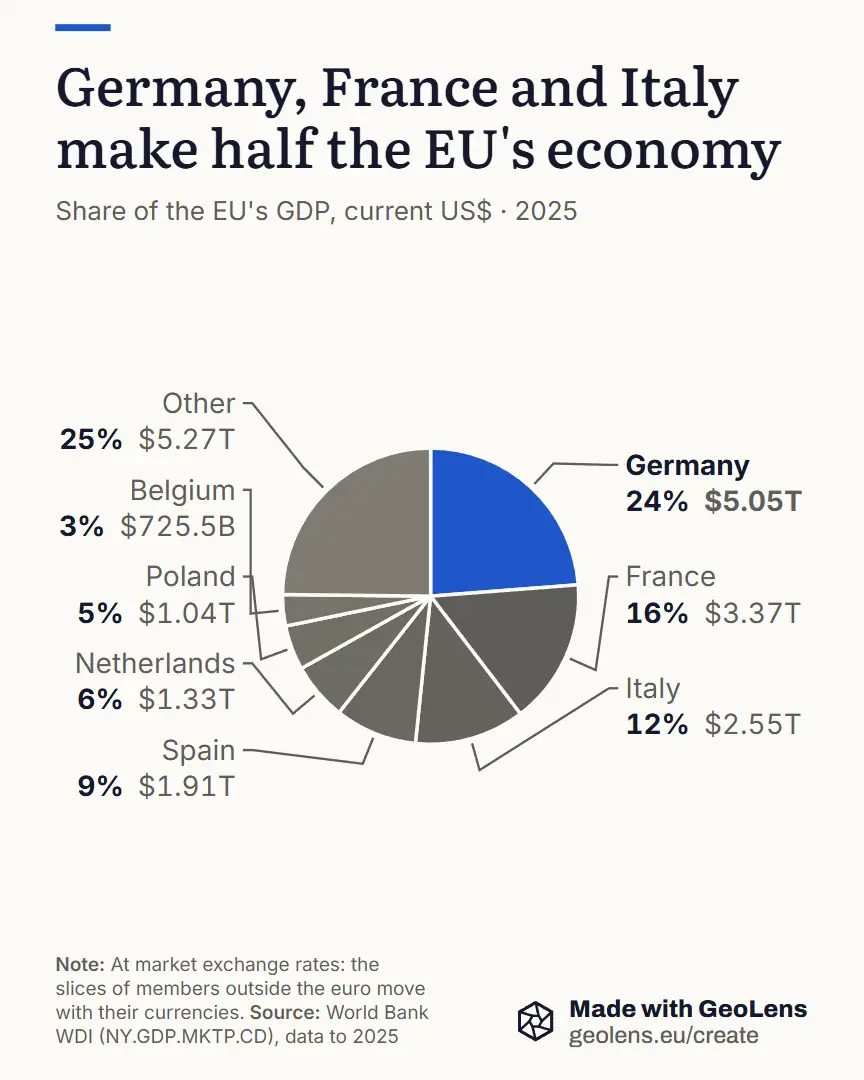
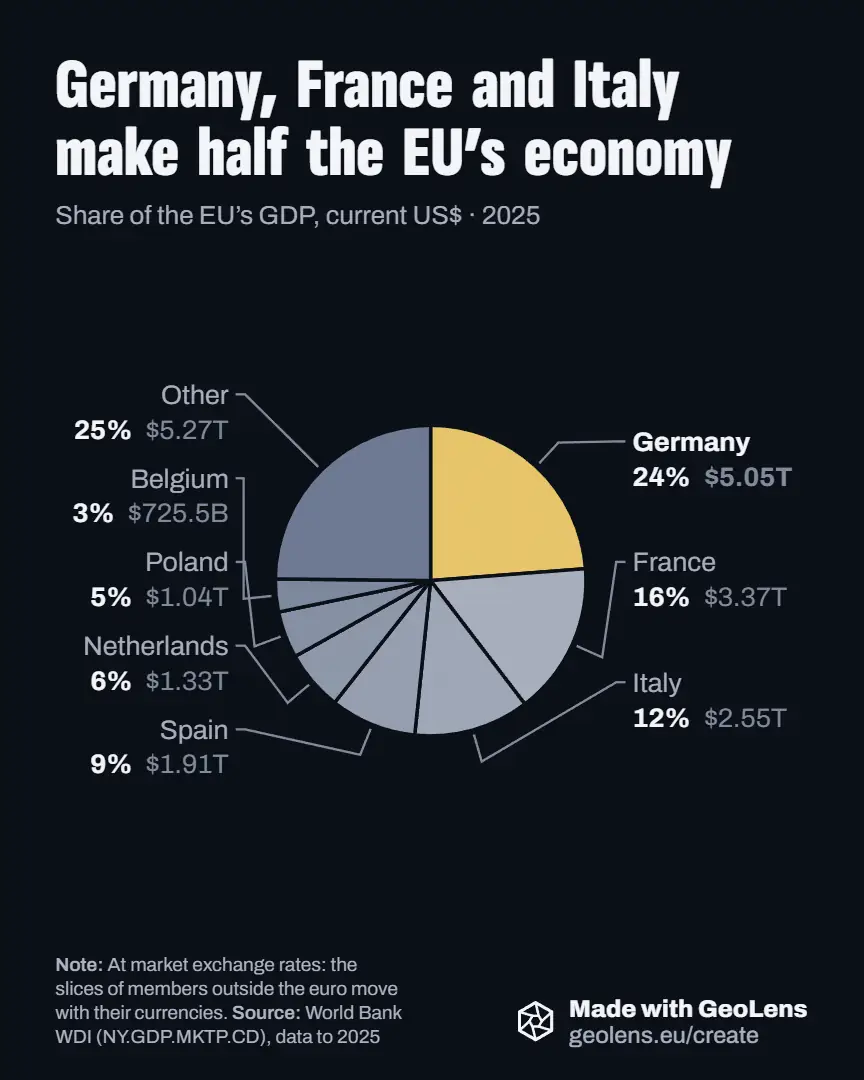
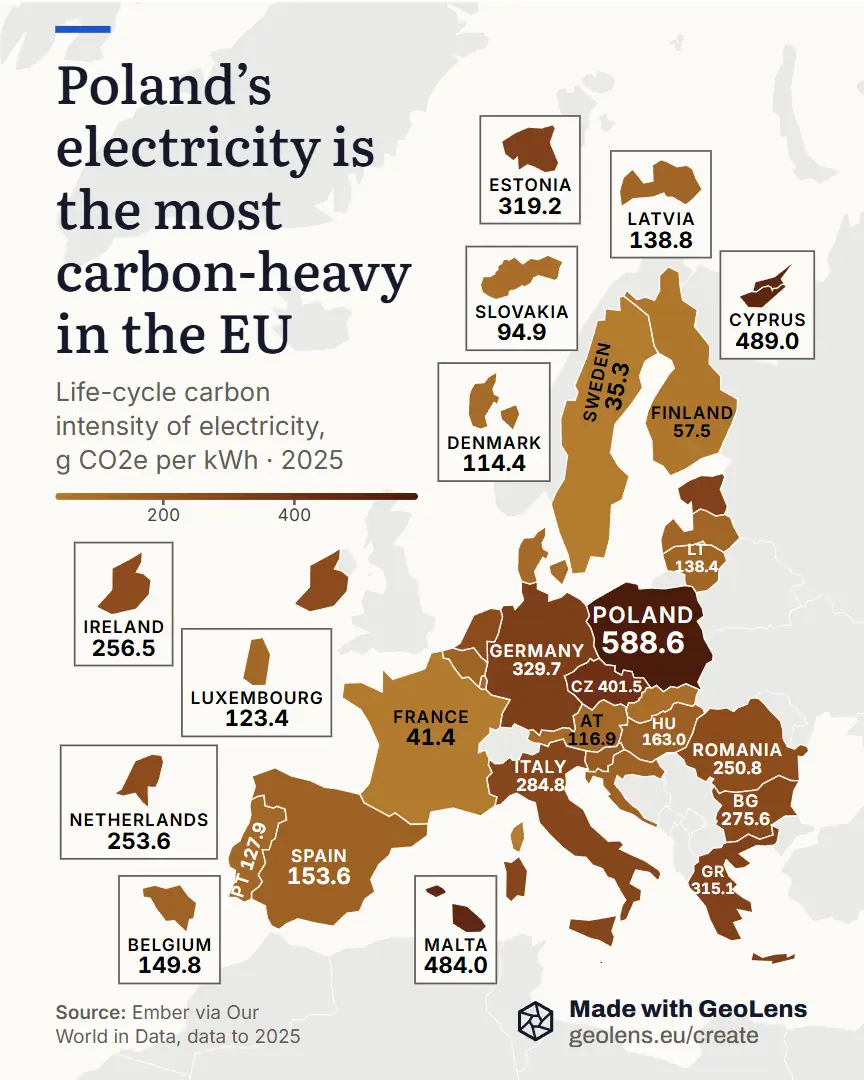
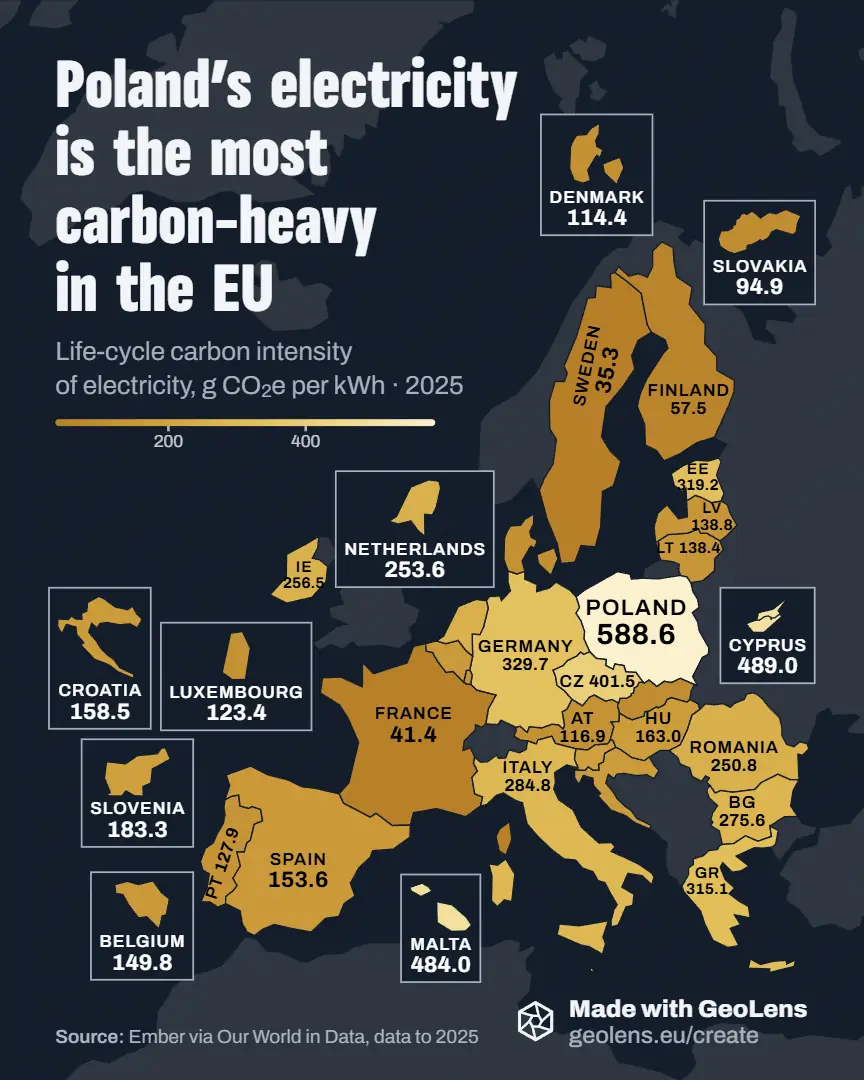
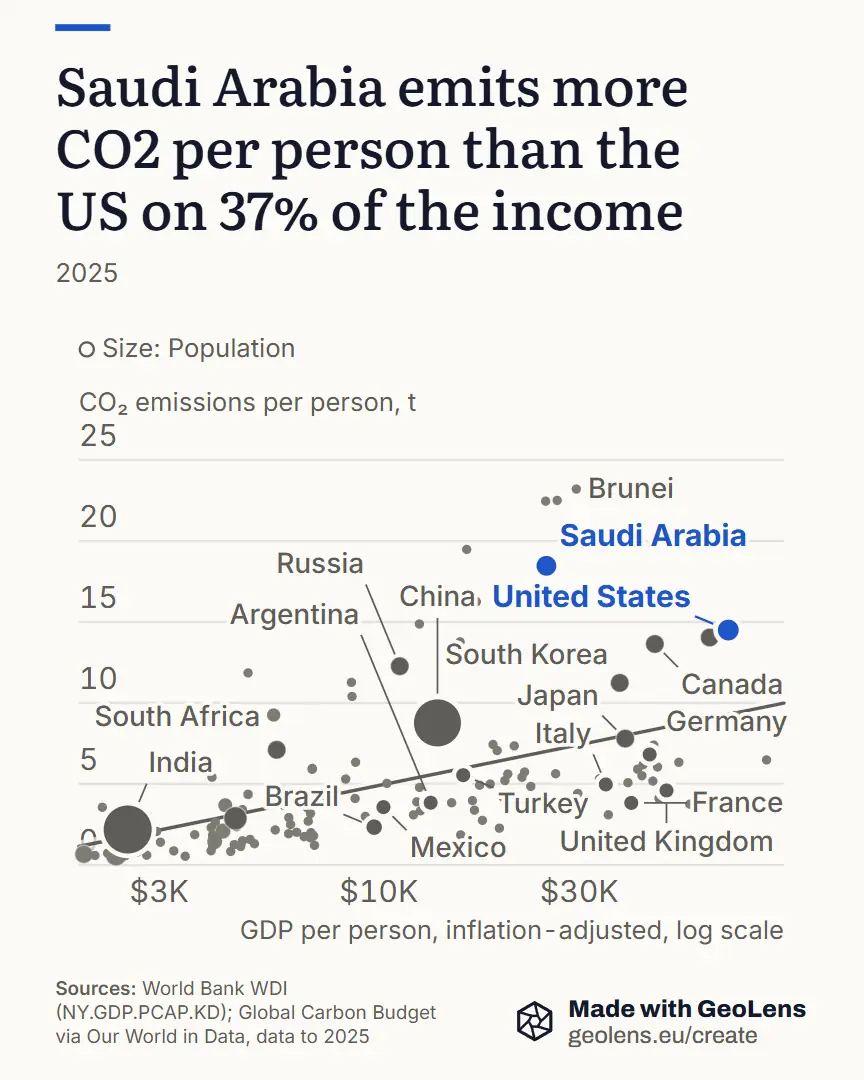
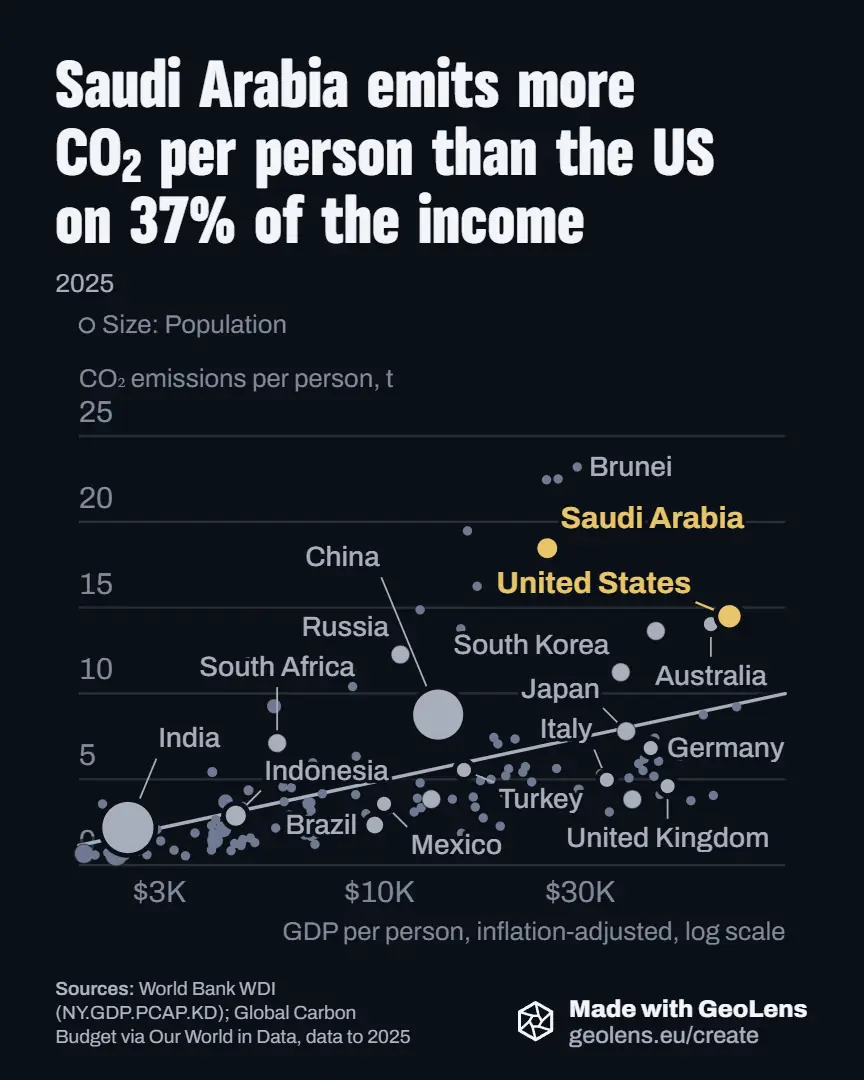
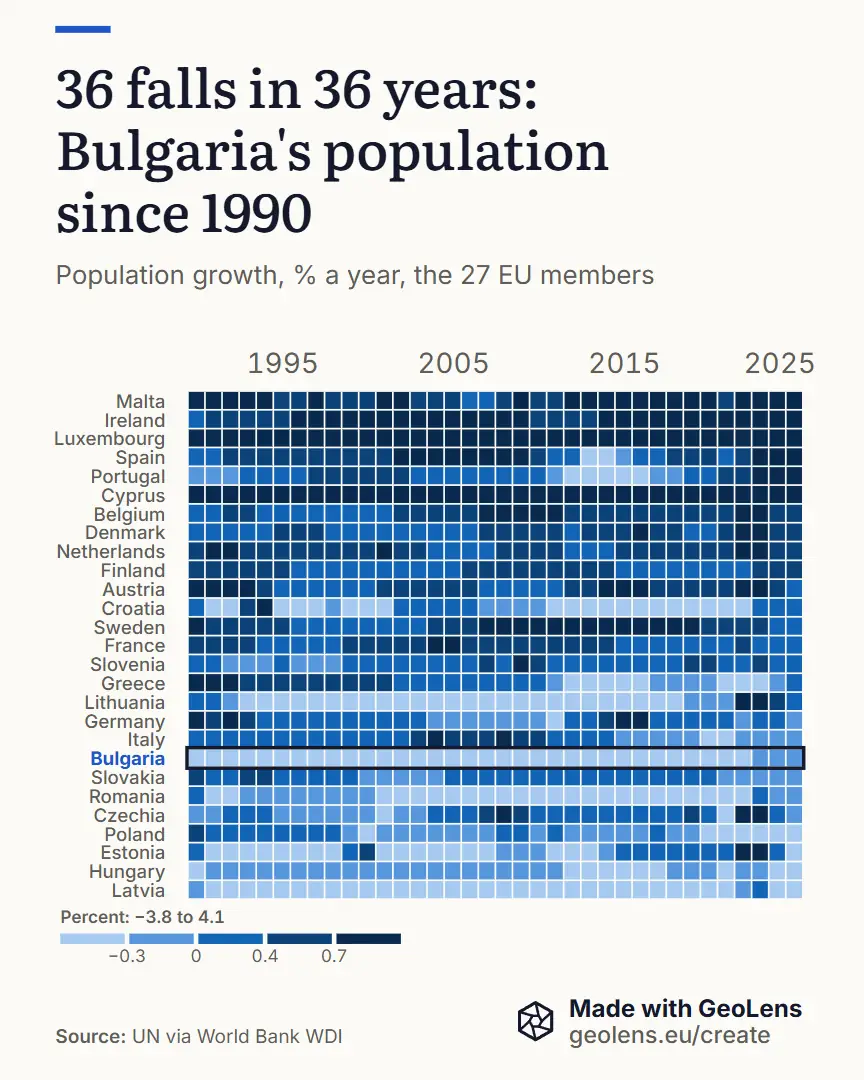
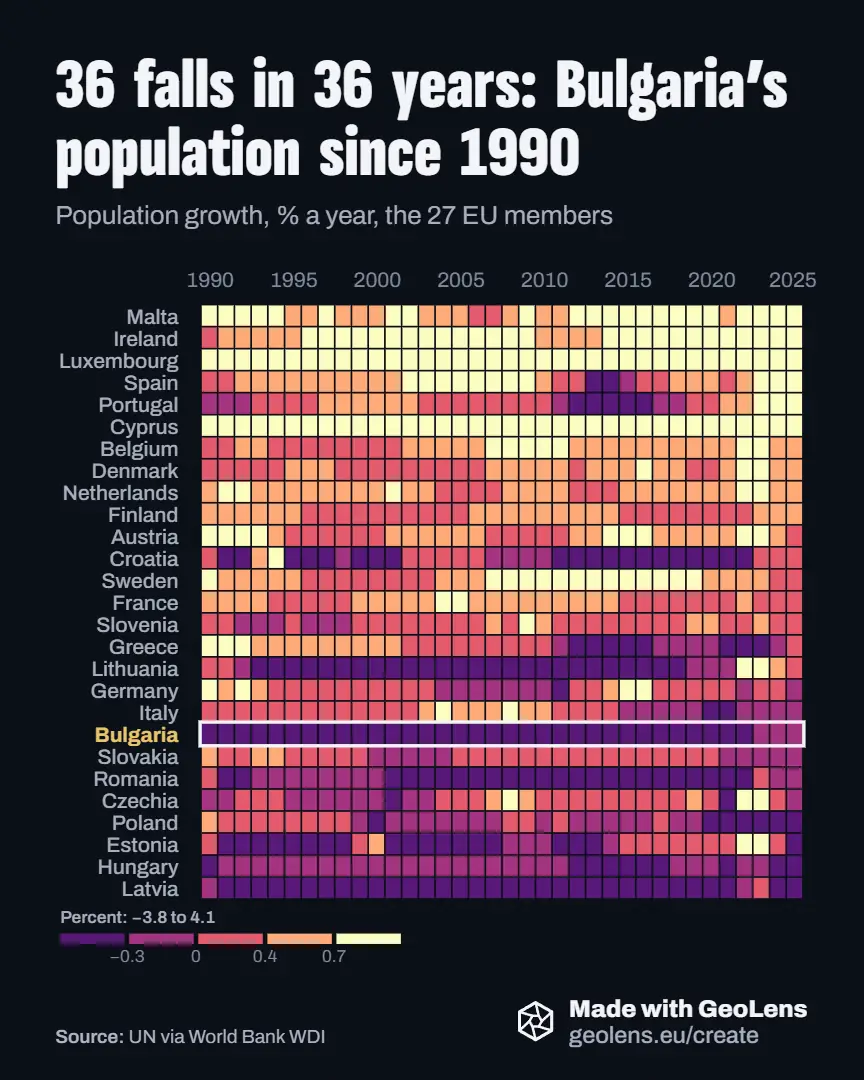
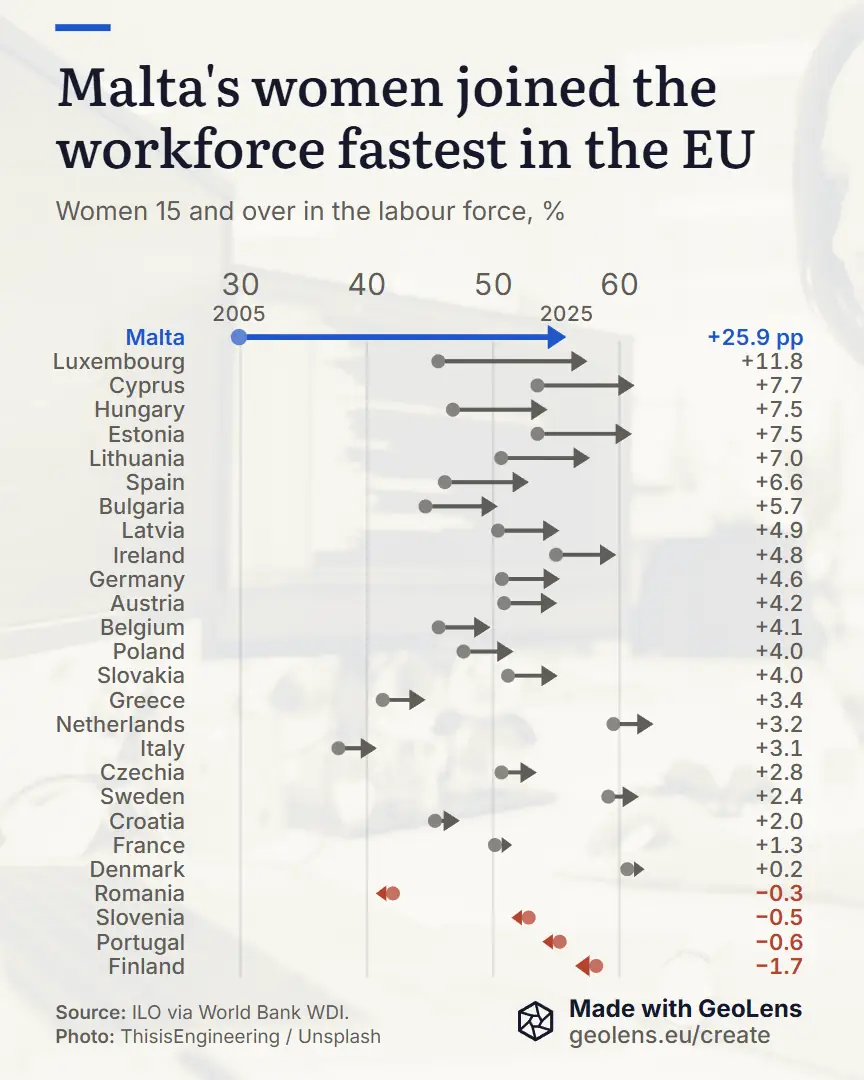
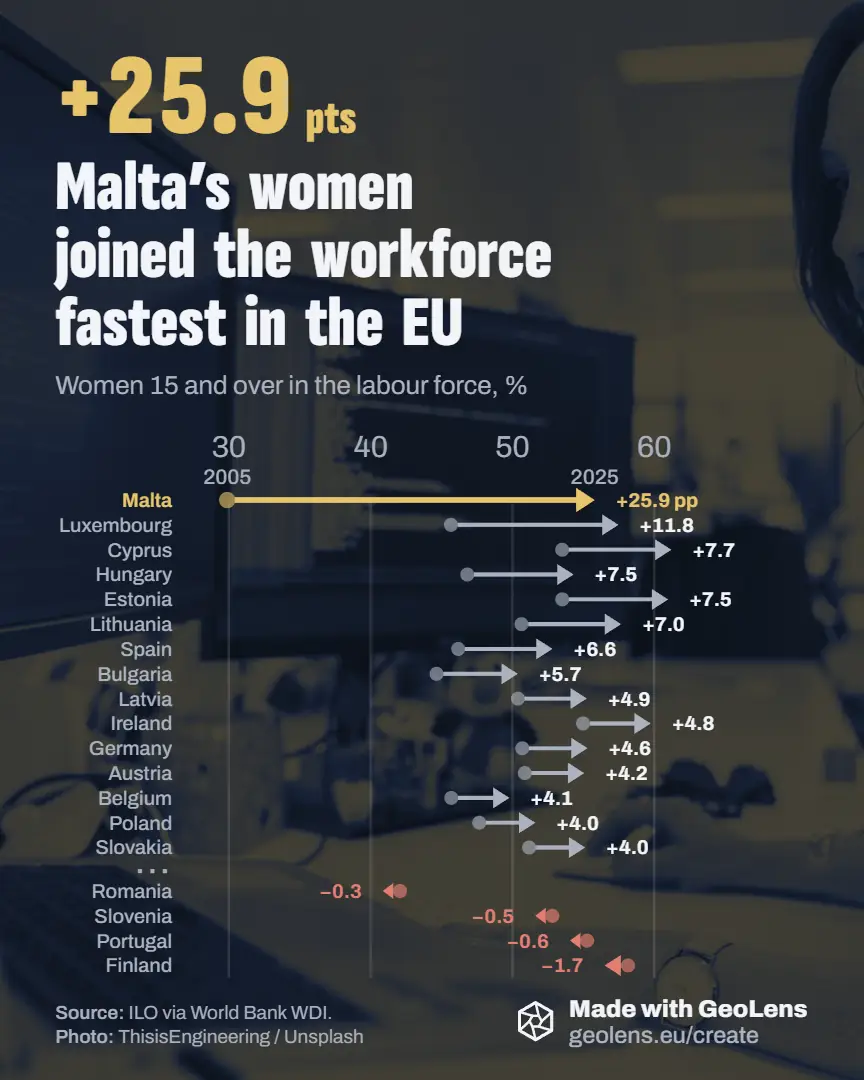
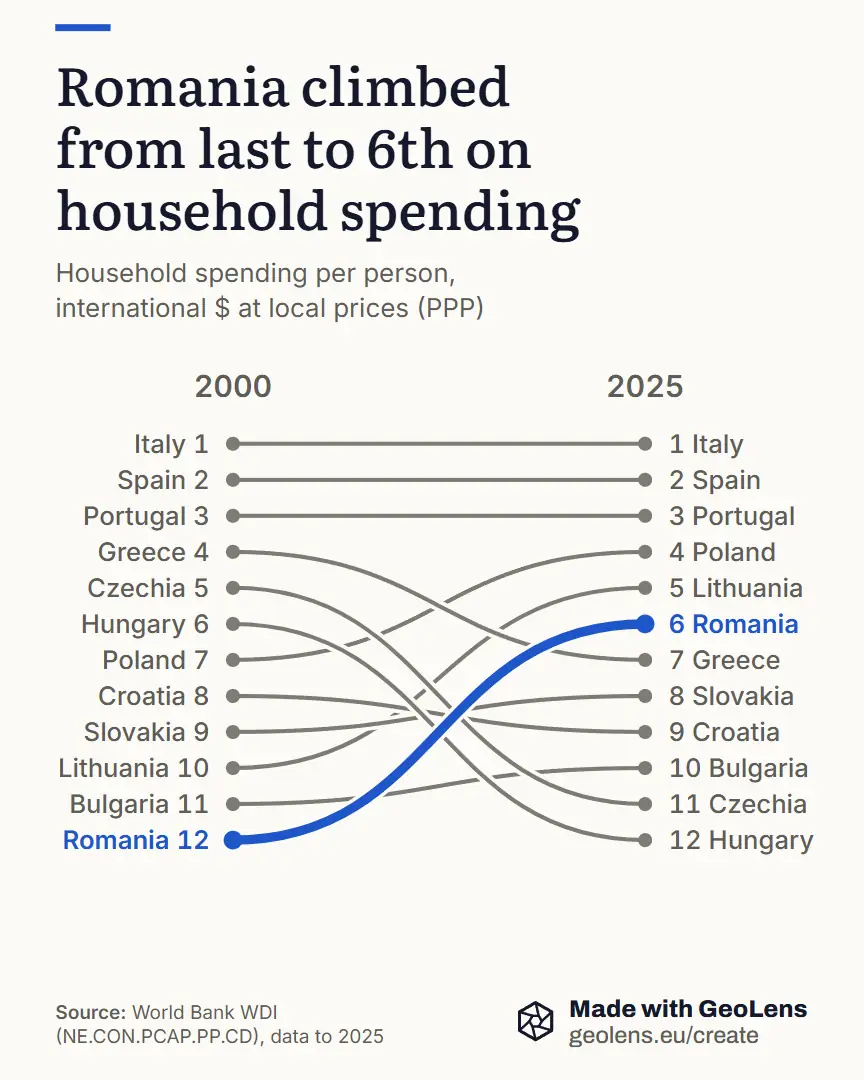
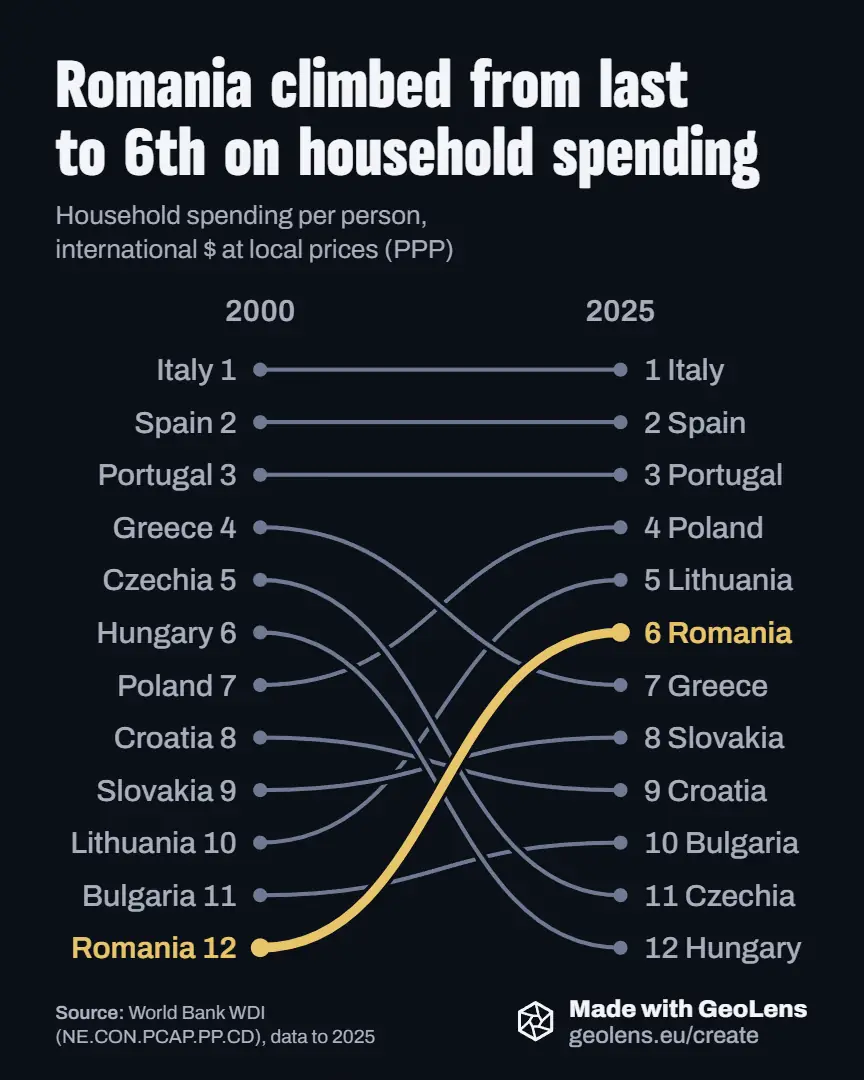
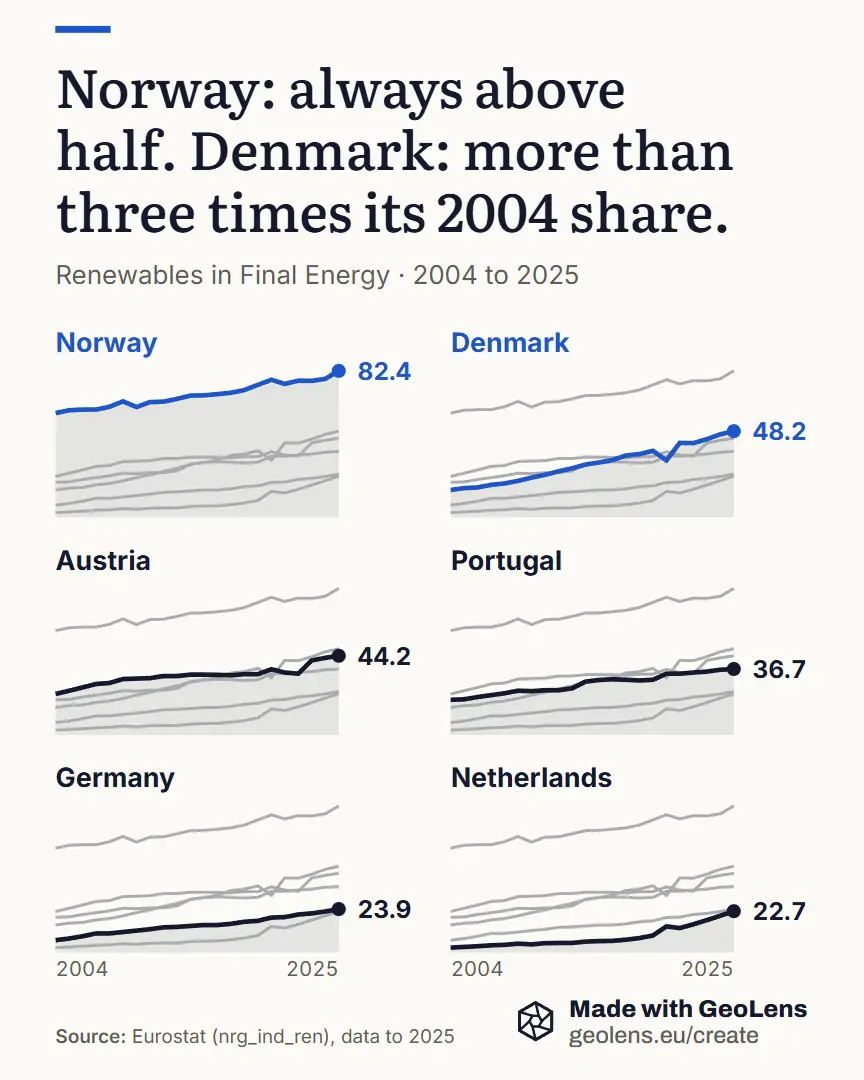
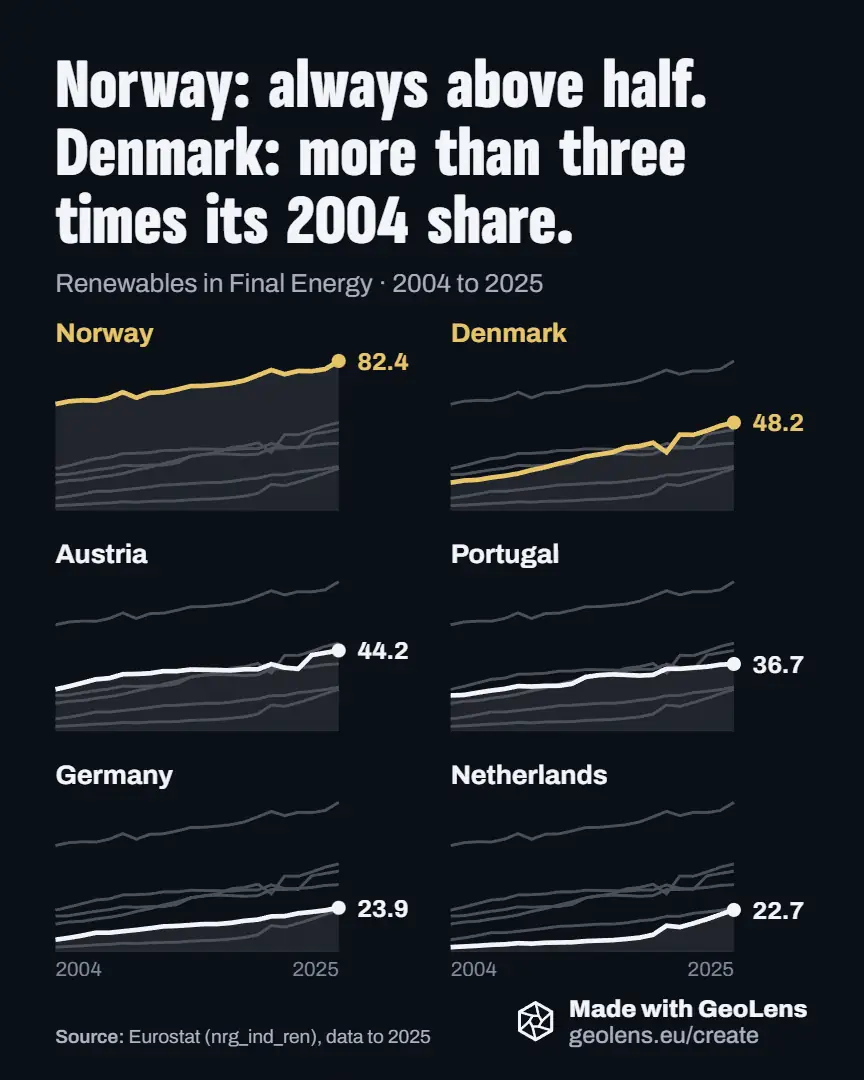
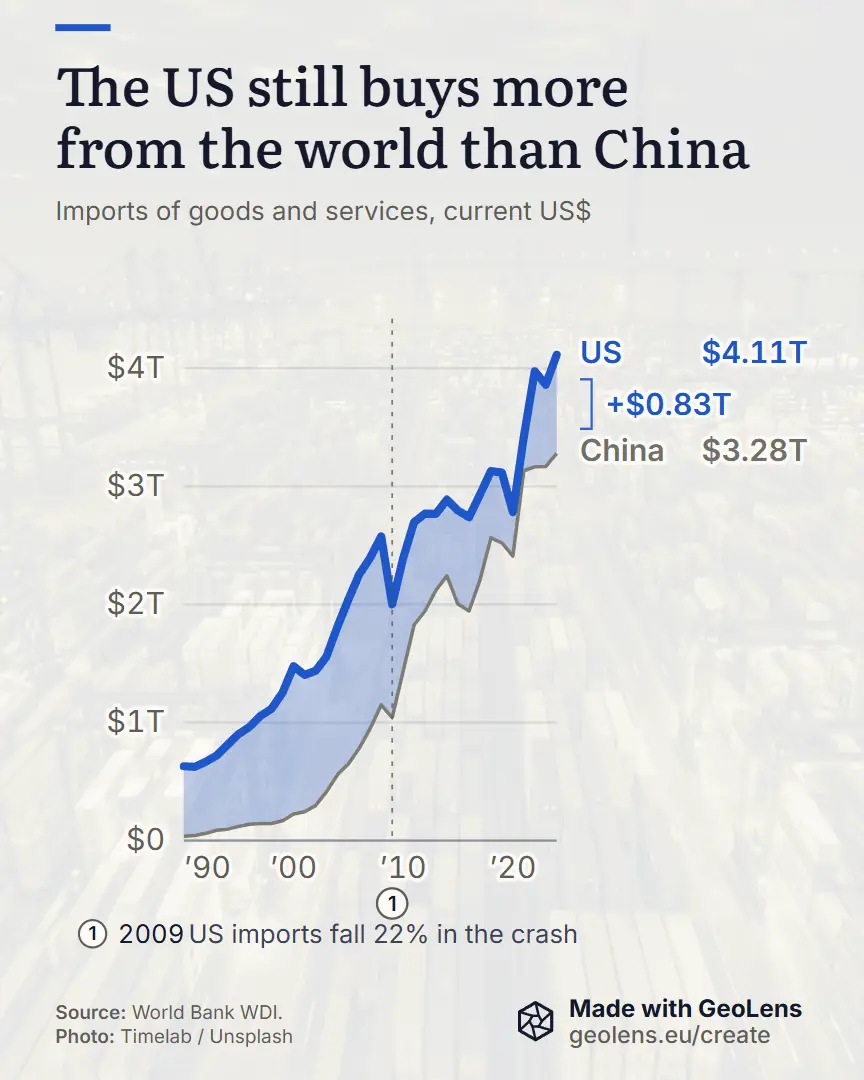
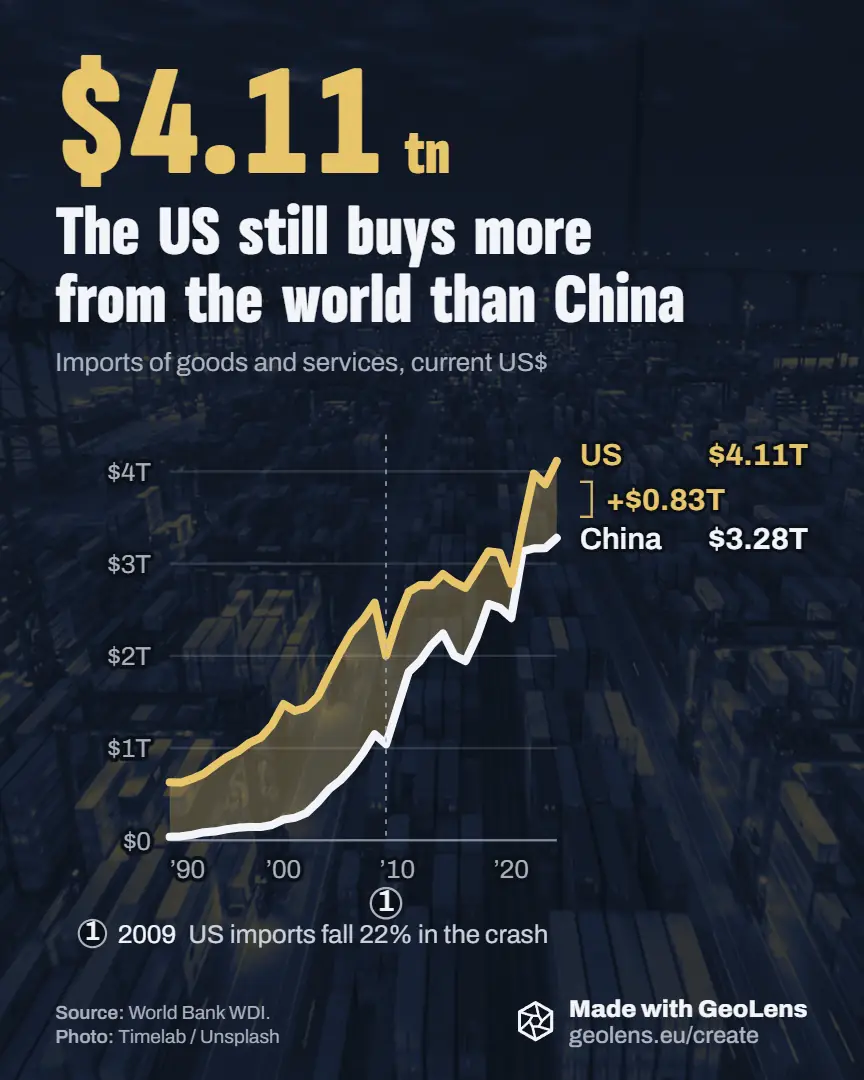
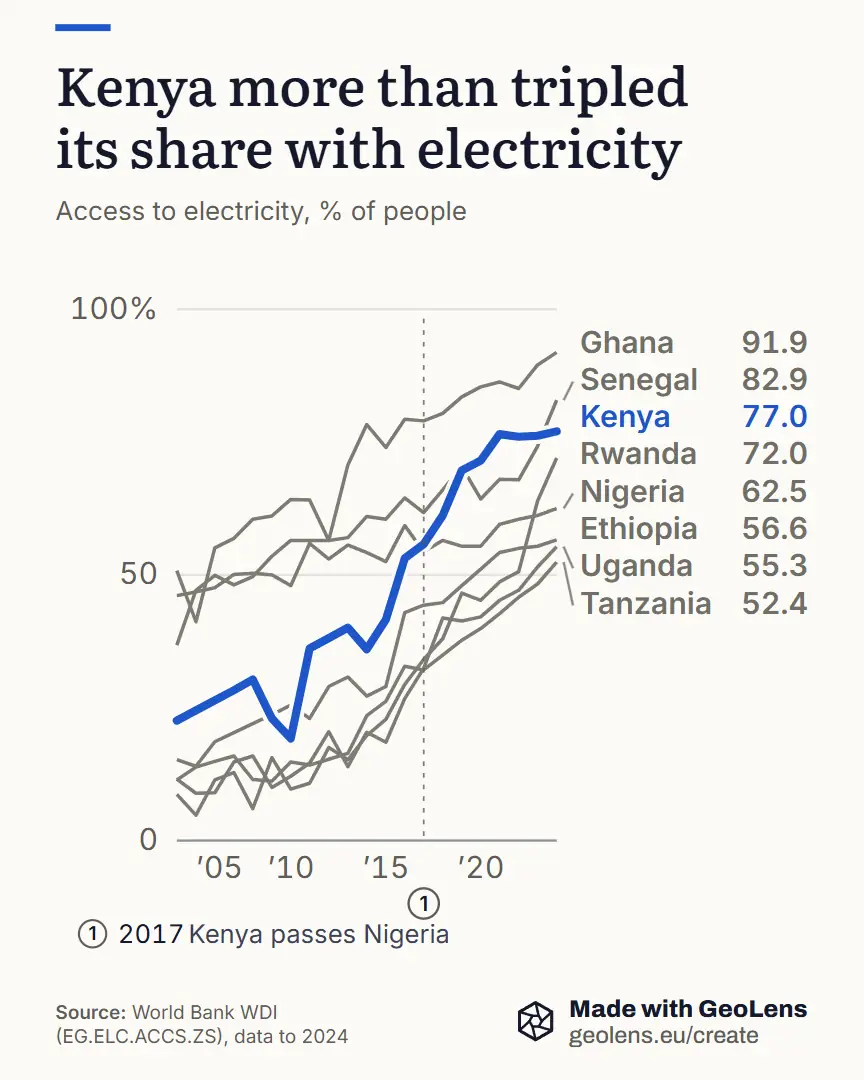
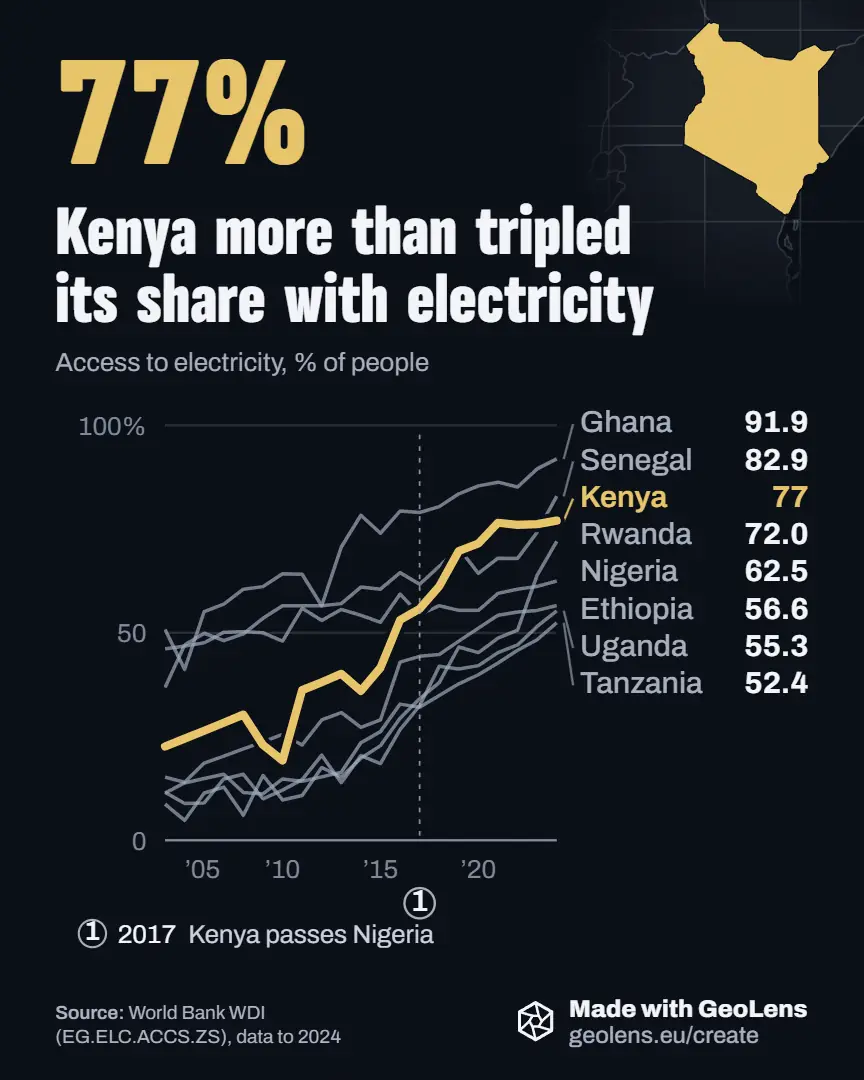
Any chart over time can race
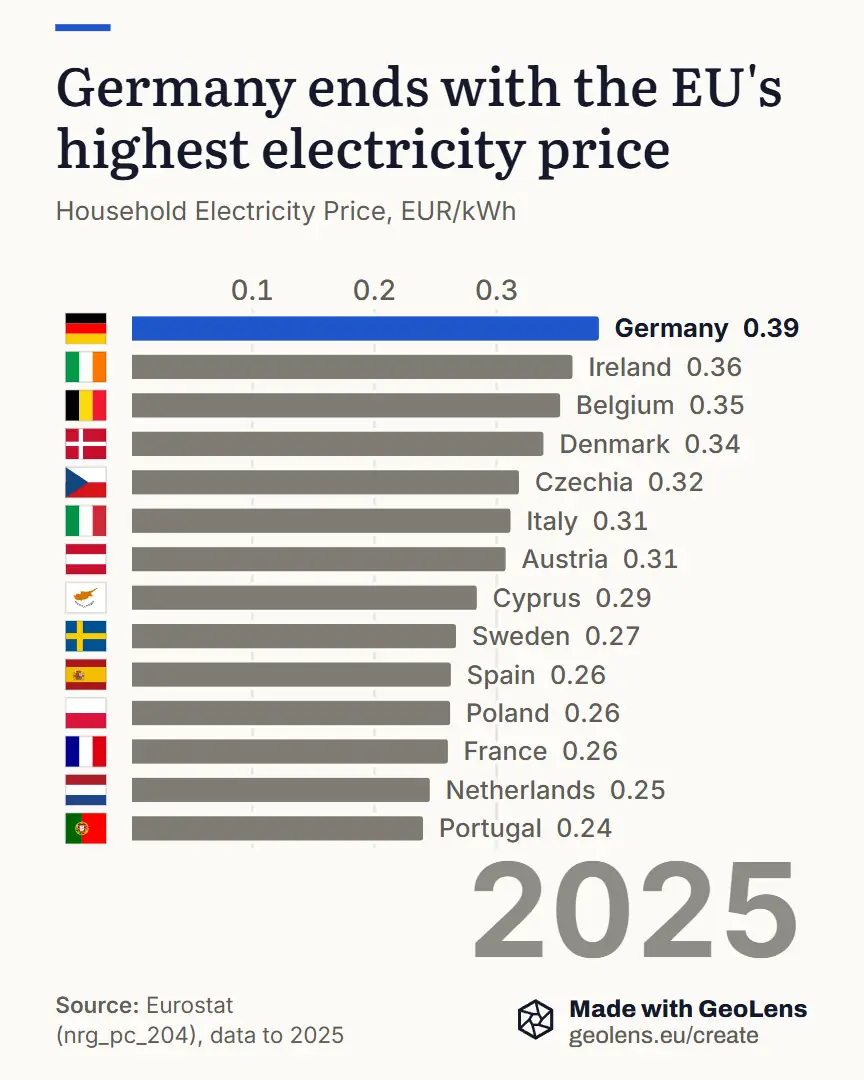
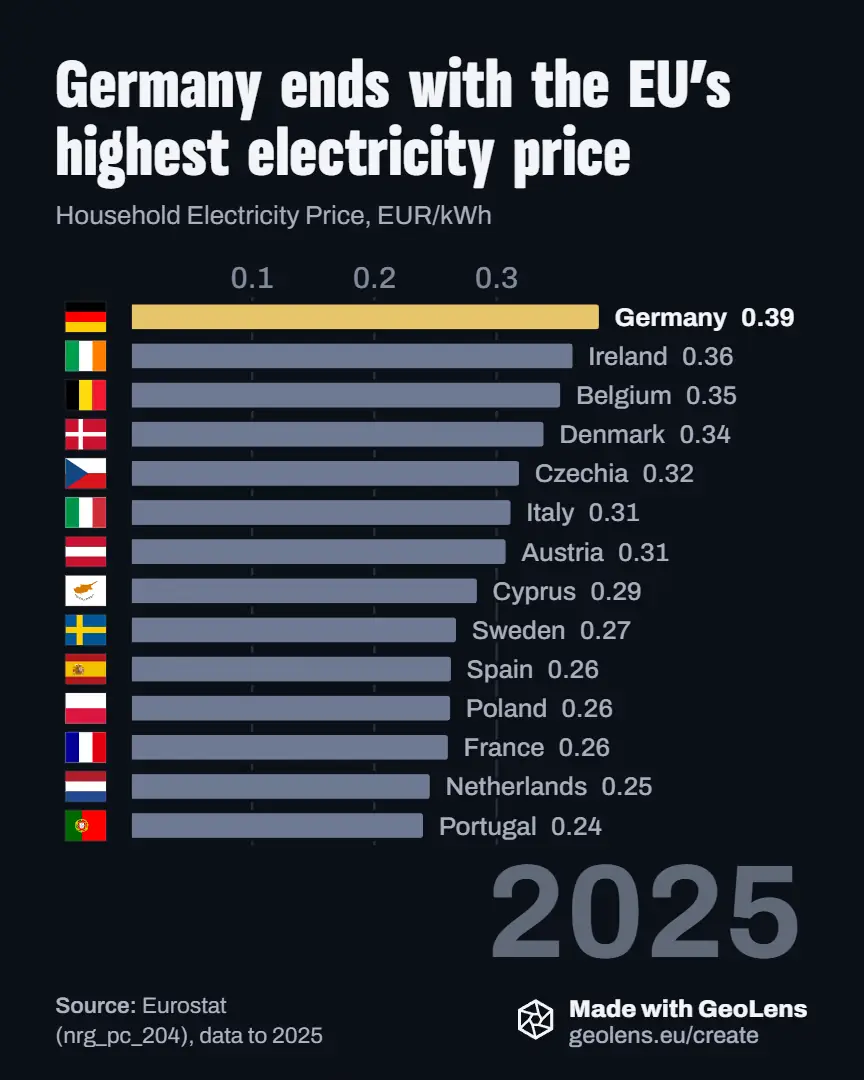
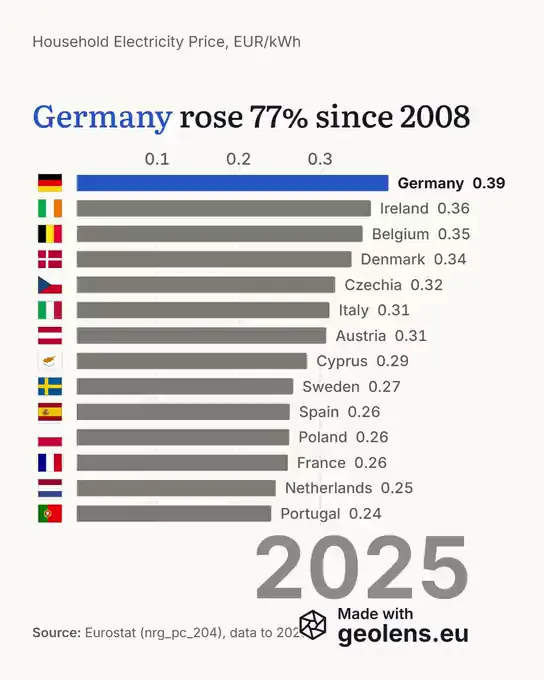
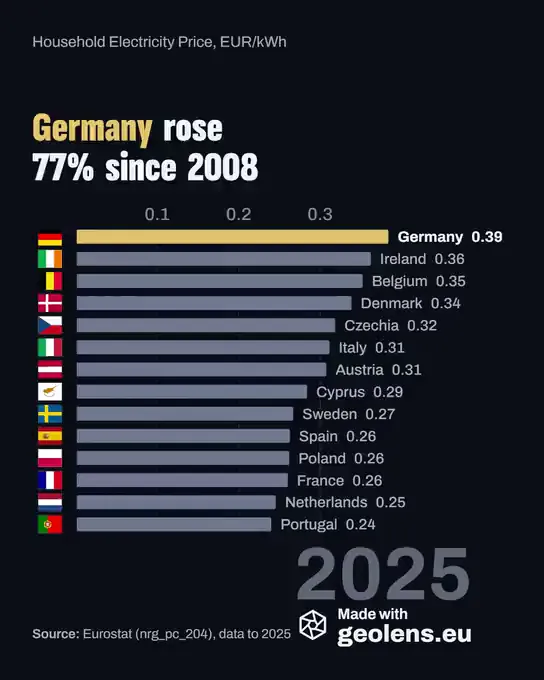
Play it in the editor on any plan.
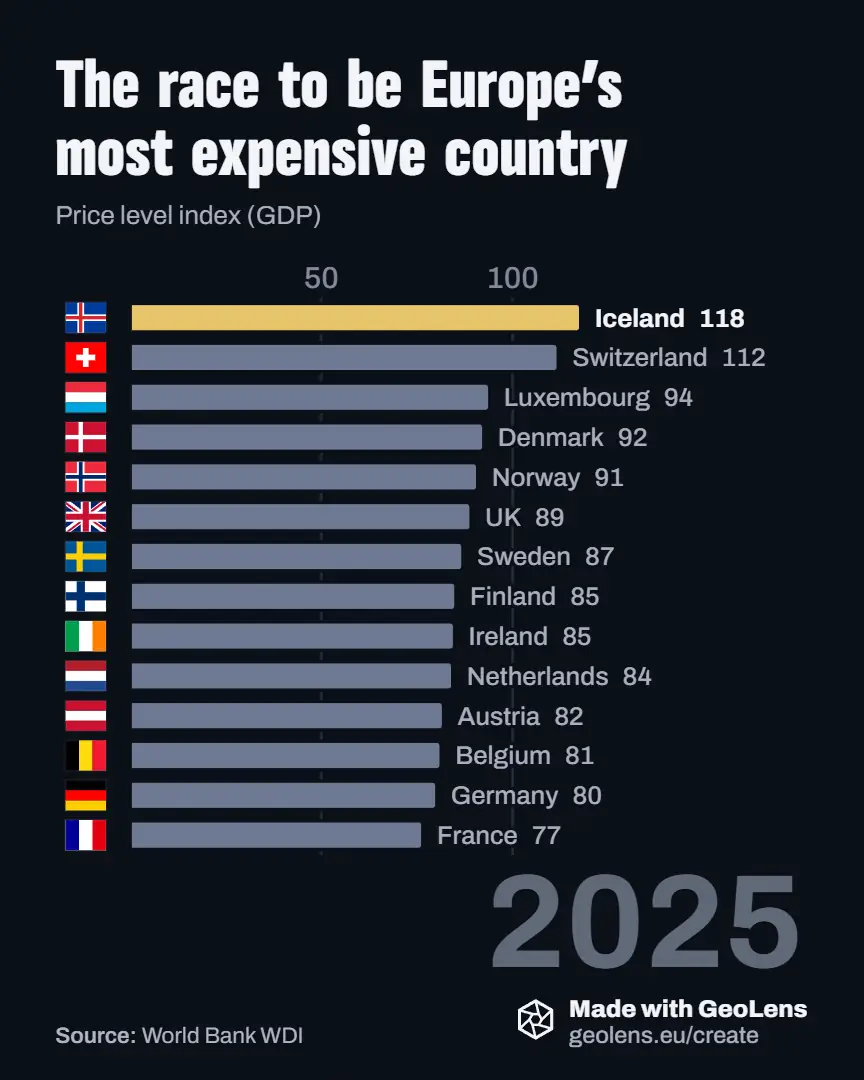
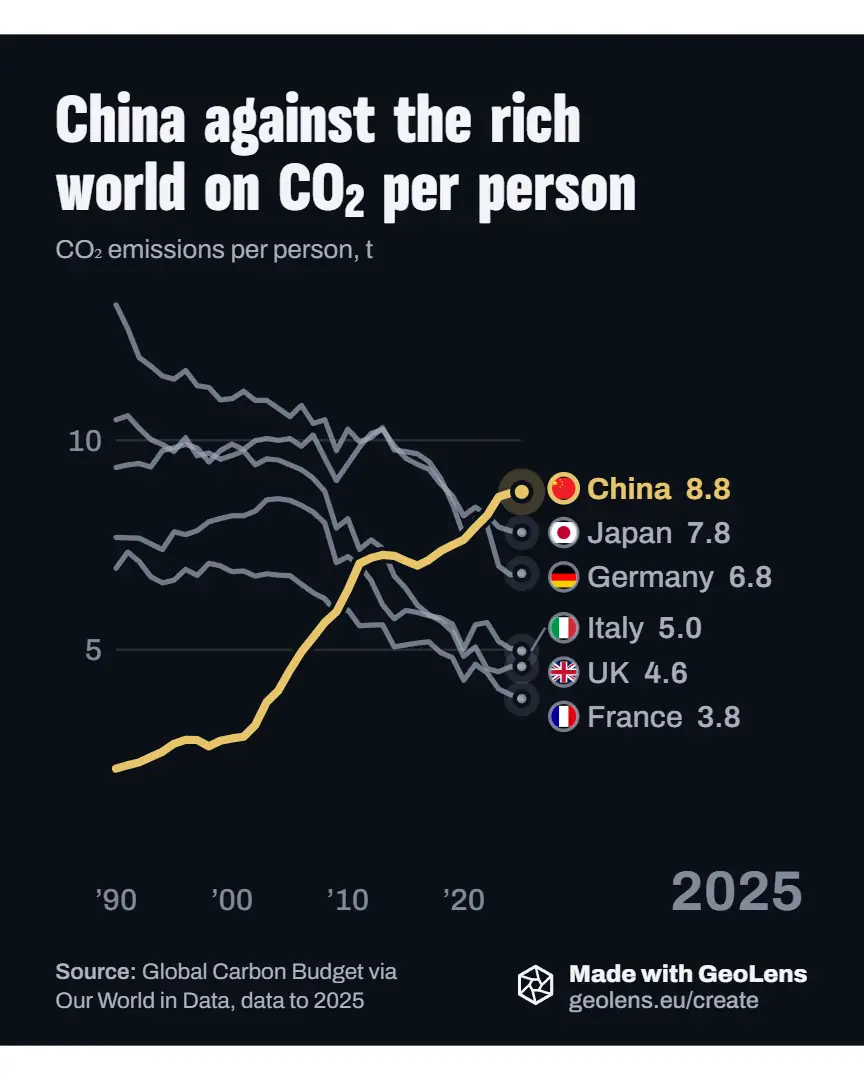
One chart, four looks
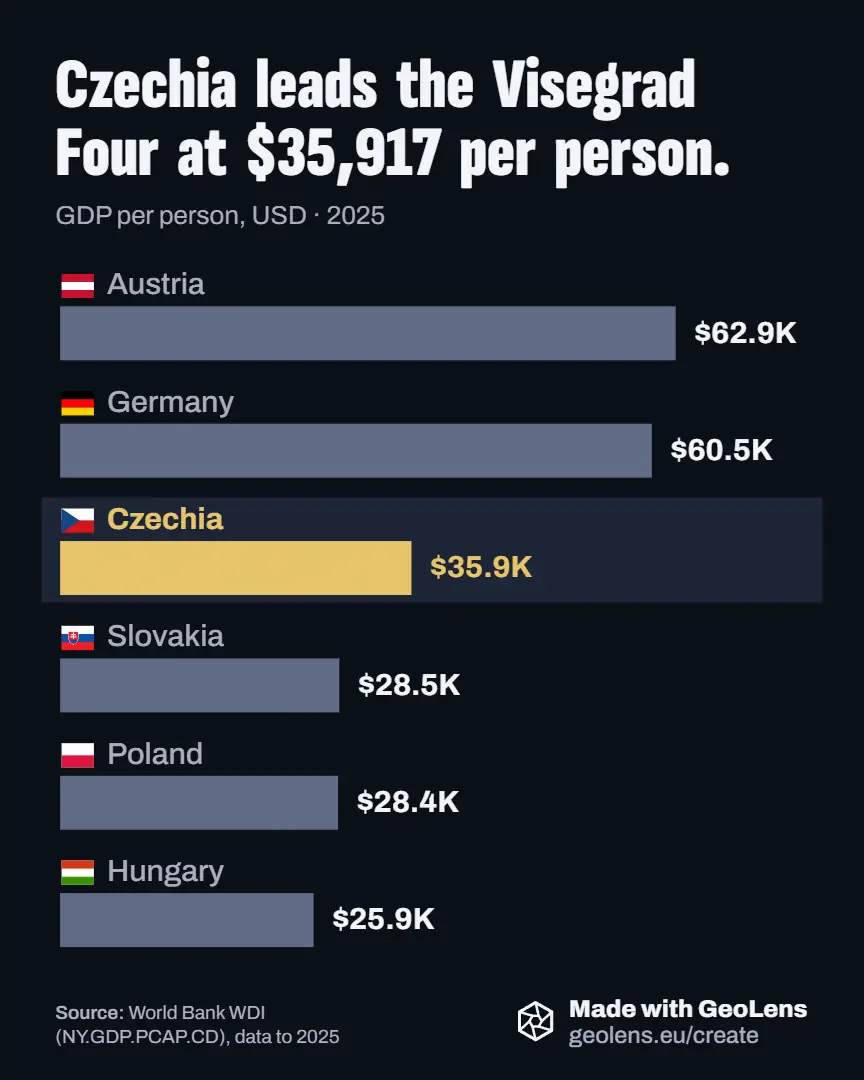
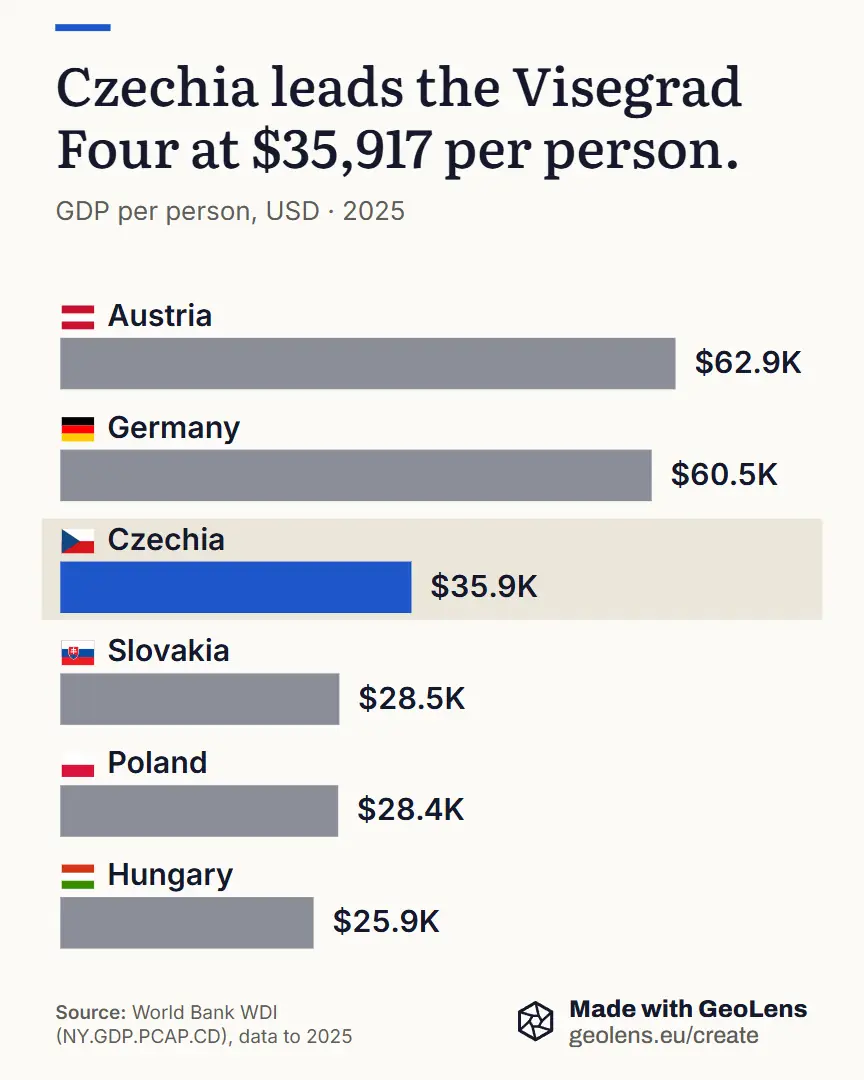
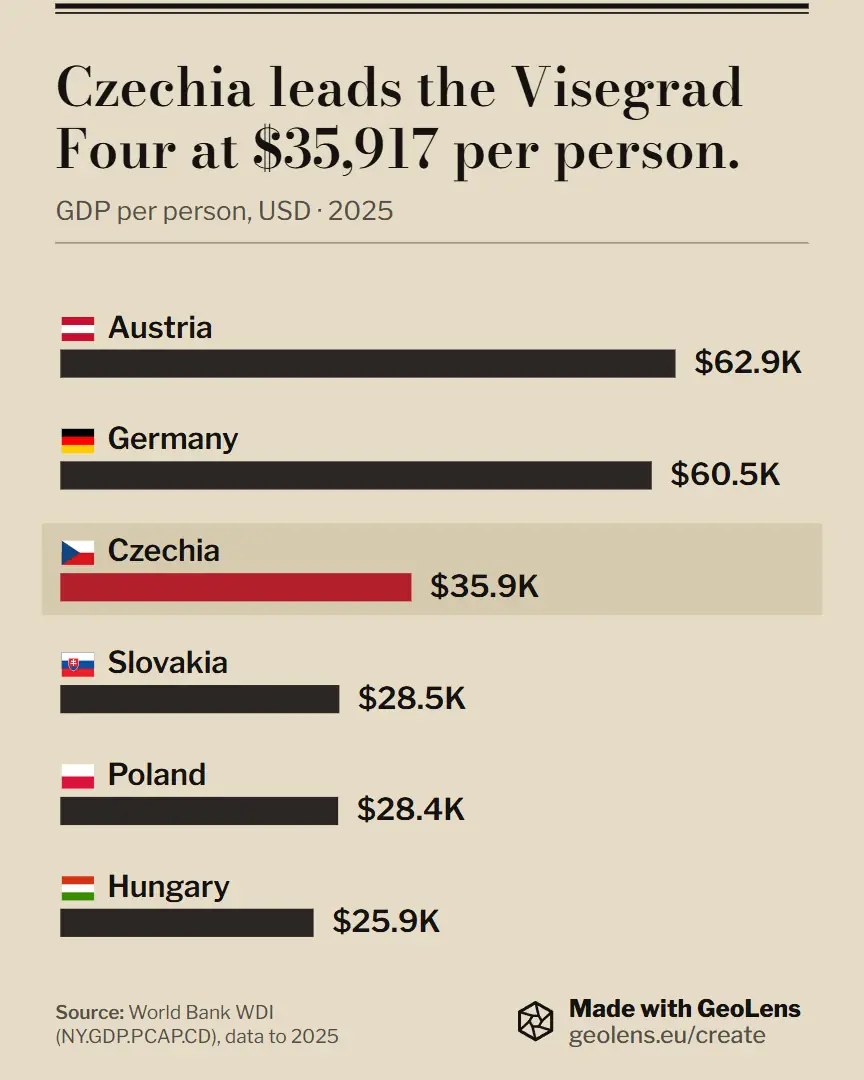
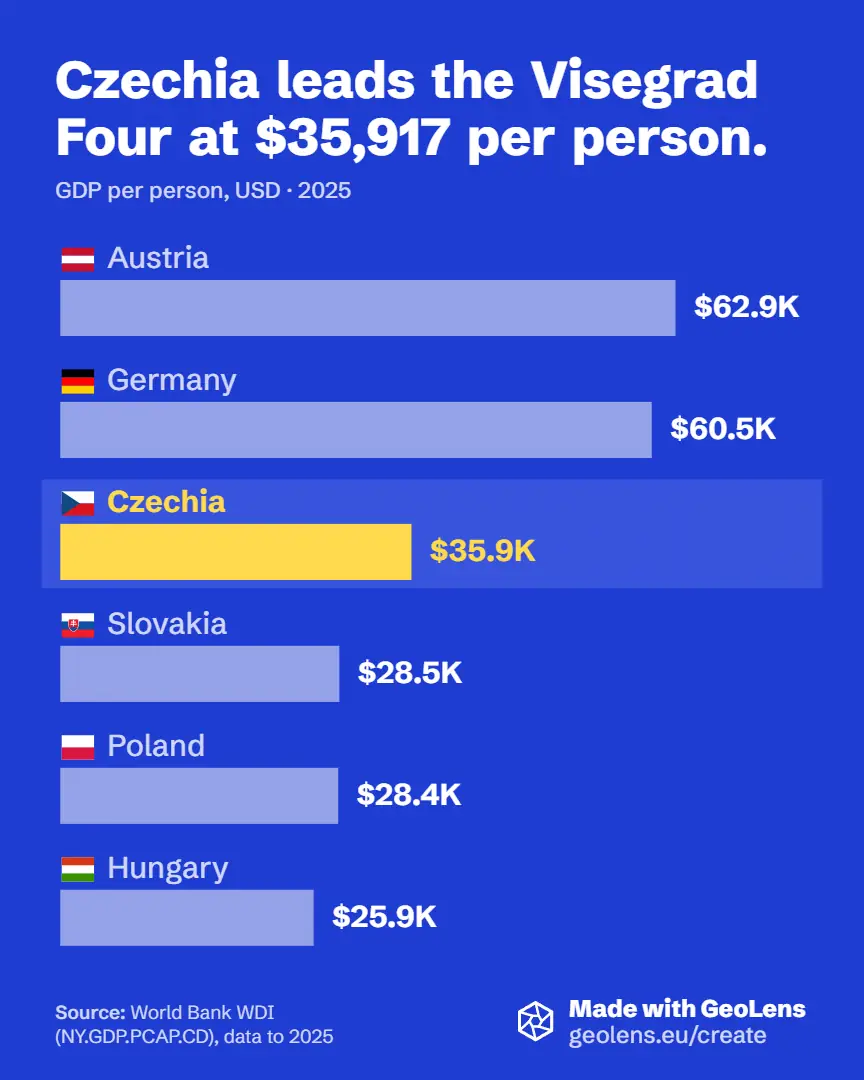
- Your colours. Set any series or highlight colour, on every plan.
- Fonts. 2 font pairs free, all 5 on PLUS.
- Brand kit on PRO. Your logo, colours and own fonts, and no GeoLens mark.
World data built in, or bring your own
Built in
25,000+ indicators from the World Bank, Eurostat, EIA and Our World in Data, refreshed on their own. The source prints under every chart.
All sourcesYour own
Paste a table, or drop a CSV or XLSX: it draws in your browser, no account needed. Any labels: products, teams, regions, not only countries. To keep it, 5 files on PLUS, 20 on PRO.
From data to your page
Prices
- Free€0Charts and maps, PNG and embed.
- PLUS€9or €89 a yearRace videos, all 4 looks, your own data.
- PRO€24or €239 a yearBrand kit and own fonts, commercial use, more of your own data.
A month, VAT included.Compare all features
Questions
Do I need an account?
You need a free account only to download or publish.
Can I bring my own data?
Yes, on every plan it draws in your browser. To keep it, 5 files on PLUS, 20 on PRO.
Can I use it commercially?
On PRO; Free and PLUS are for personal use.
Can I keep my work private?
Yes, on PLUS and PRO: a private piece lives at a secret link, not listed and not searchable.