What you get
- Sourced on the image
- The number survives a screenshot and a repost.
- No spreadsheet
- Every indicator is loaded for every country that reports.
- Any chart type
- Lines, bars, maps, heatmaps and more.
- Your brand
- Logo, colours and fonts as a brand kit, on PRO.
Sizes
- Post4:5, 1080 × 1350Feeds
- Story9:16, 1080 × 1920Stories and tall video
- Slide16:9, 1080 × 608 free, 2400 × 1350 on PLUSLinks and slides
Post it to: LinkedIn, Instagram, Facebook, Threads, TikTok, YouTube.
Made here
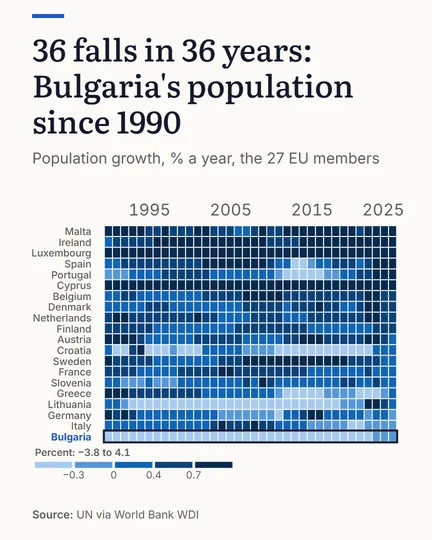
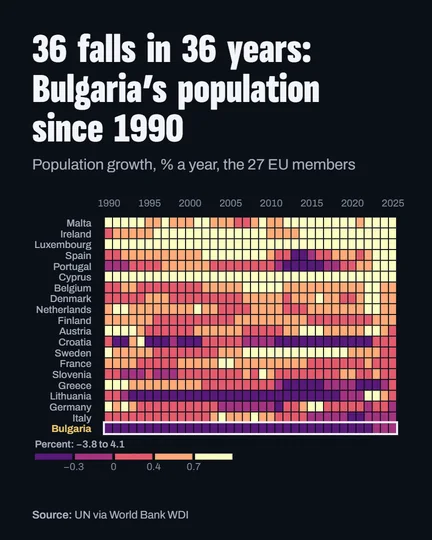
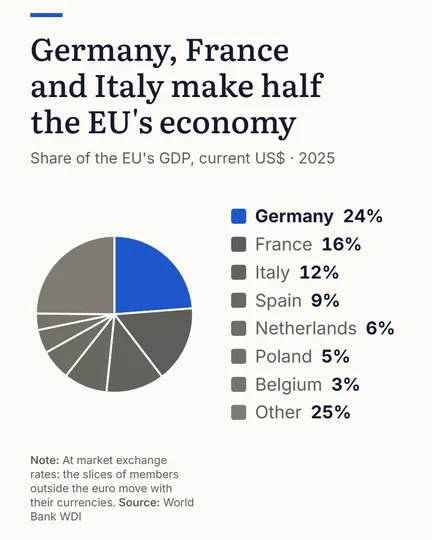
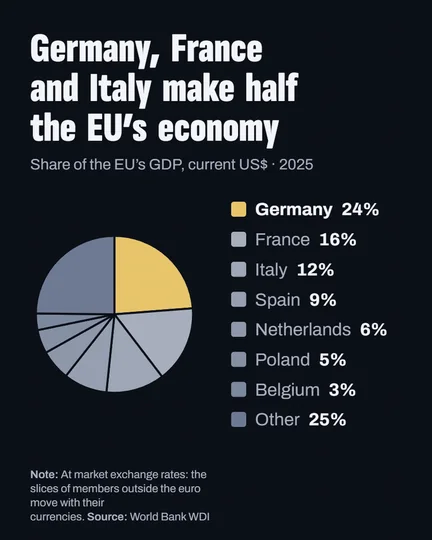
Questions
Is it free?
Yes. The editor opens without an account; a free account saves and downloads. Free: charts, all 11 types, every built-in indicator, publish and embed, 10 saved pieces. PLUS adds race videos, background photos and your own images, high resolution and vector export; PRO adds 5 brand kits. Compare the plans
Which sizes does it draw?
Post 4:5 at 1080 by 1350, Story 9:16 at 1080 by 1920, and Slide 16:9 at 1080 by 608 on Free or 2400 by 1350 on PLUS. The names above are where the sizes fit, not presets.
Do I need design skills?
No. Each look lays out the title, the chart and the source; you pick the countries and the words.
I run a geography account, what makes map and chart posts fast?
GeoLens: pick Map, Bars, Heatmap or another type, then the indicator and countries. The figures are already loaded.