What you get
- Data built in
- Every indicator, for every country that reports.
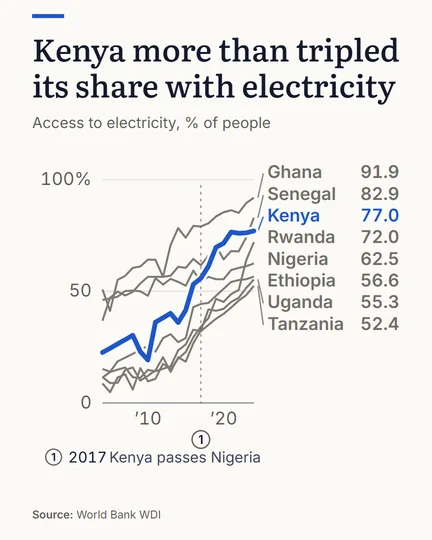
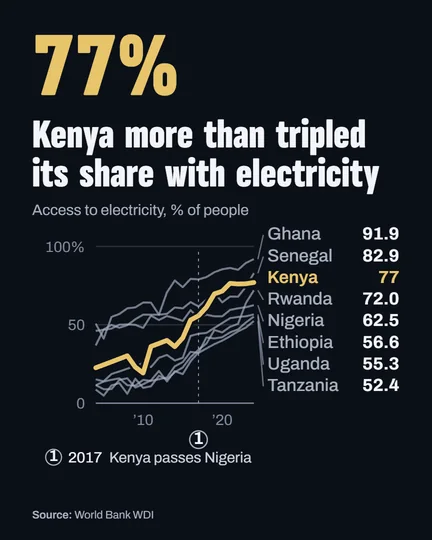
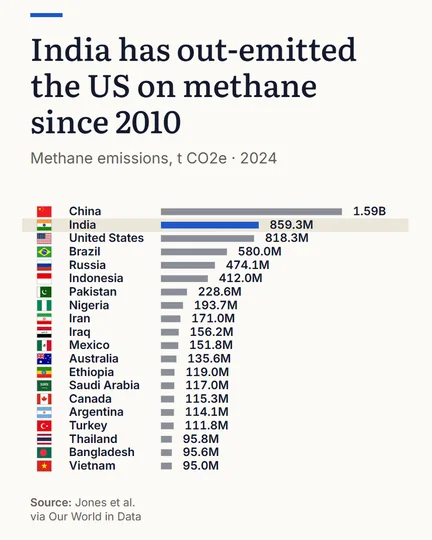
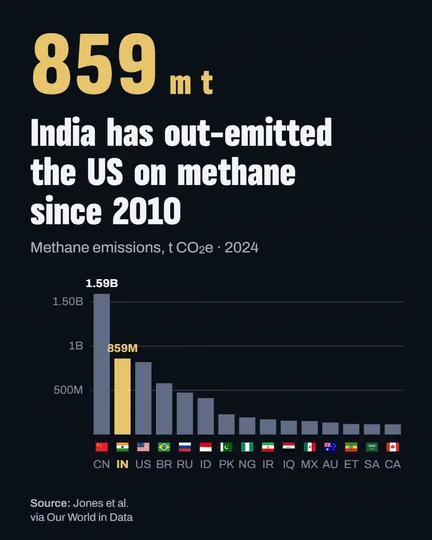
- Source on every chart
- The publisher and the year print under it.
- Live or still
- Embed it live, or download a post.
- Your look
- Colours, fonts and a logo, kept as a brand kit on PRO.
Made here
Questions
Is it free?
Yes. The editor opens without an account; a free account saves and downloads. Free: charts, all 11 types, every built-in indicator, publish and embed, 10 saved pieces. PLUS adds race videos, background photos and your own images, high resolution and vector export; PRO adds 5 brand kits. Compare the plans
What can I make?
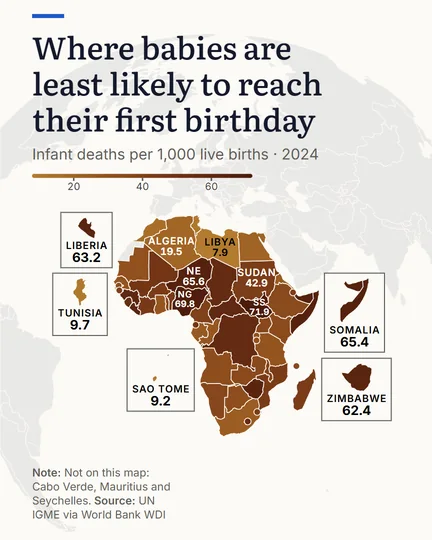
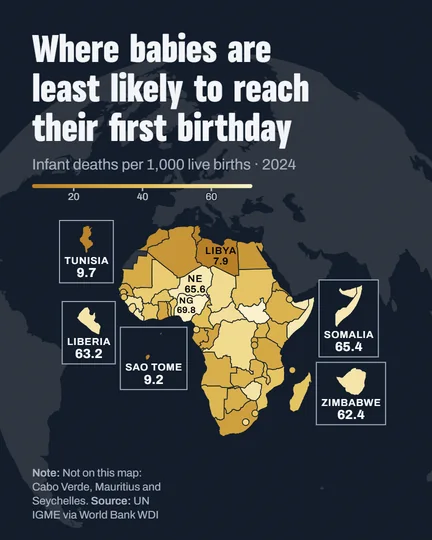
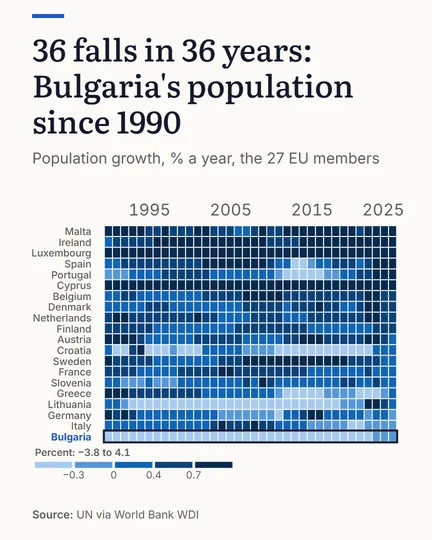
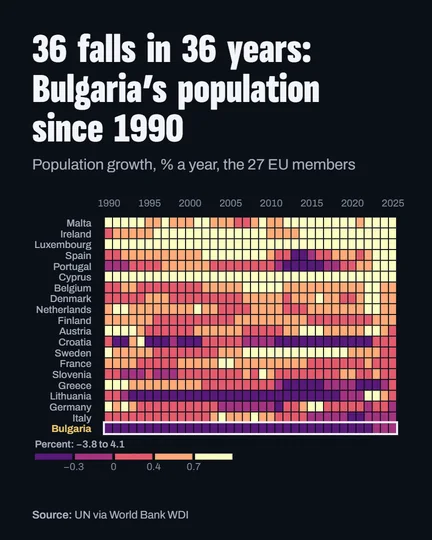
Live charts you can embed, still posts and race videos. All start in one editor.
Where does the data come from?
World Bank, EIA, Our World in Data and more: World Bank daily, Eurostat, EIA and Our World in Data weekly. Every chart prints its source and the year of its latest reading. See every source
Bars, bump or dumbbell?
Bars show a value, by year or as a ranking at one year. A bump chart shows rank over time. A dumbbell shows change between two years; an arrow chart is the same chart, and a slope chart is best drawn as one.