What you get
- Mark what happened
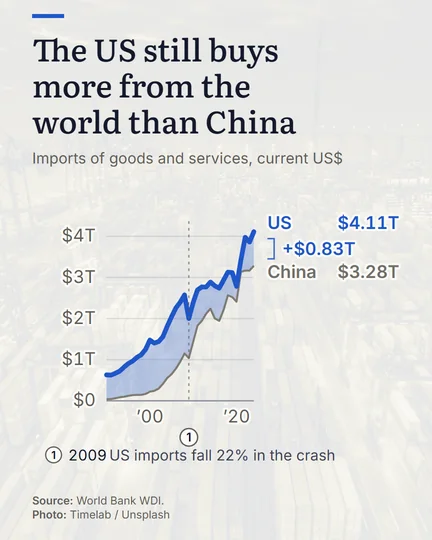
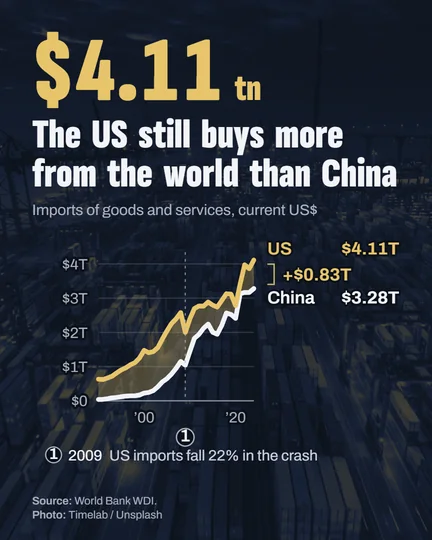
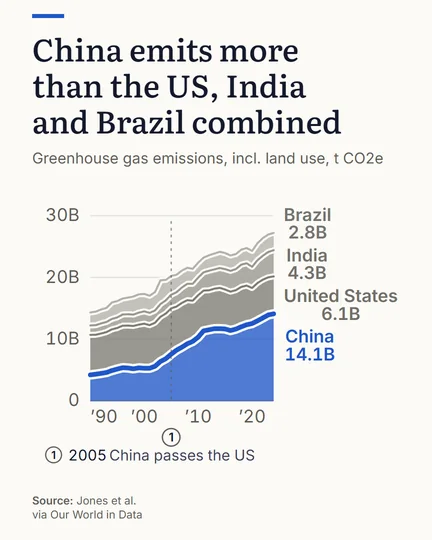
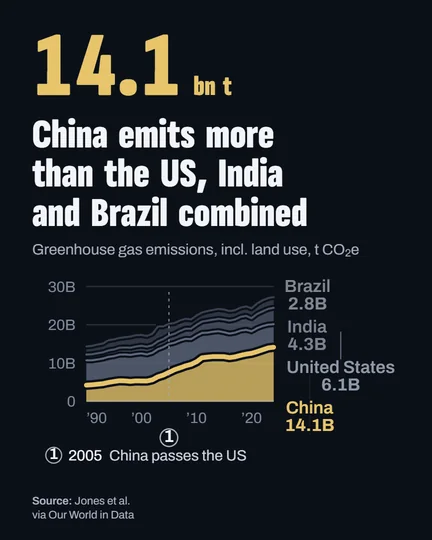
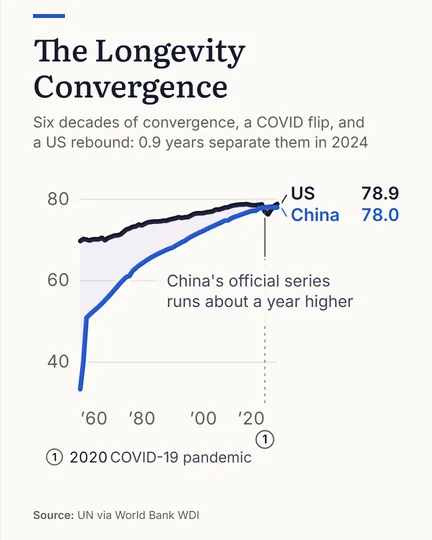
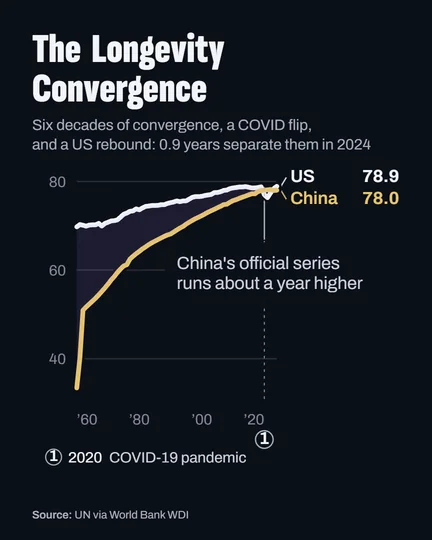
- Annotate an event year, or where one line overtakes another.
- Fill and stack
- Fill the gap between two lines, or stack them to a total.
- Small multiples
- A grid with one panel per country, on a shared scale for levels or a free one for shapes.
- Your years
- Set the start and end year; the source line follows.
Made here
Questions
Can I embed the line chart on my site?
Yes. A chart is live and embeddable, and it updates when the data refreshes.
Can I compare countries on one chart?
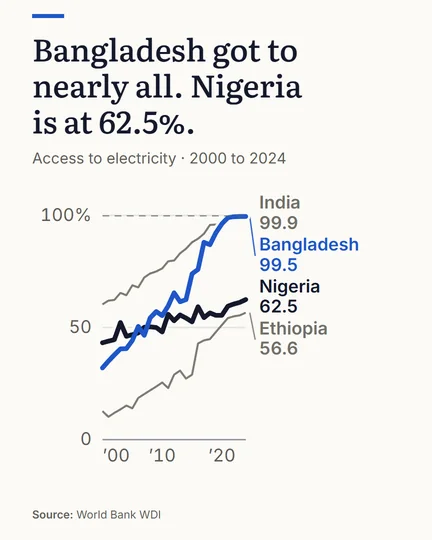
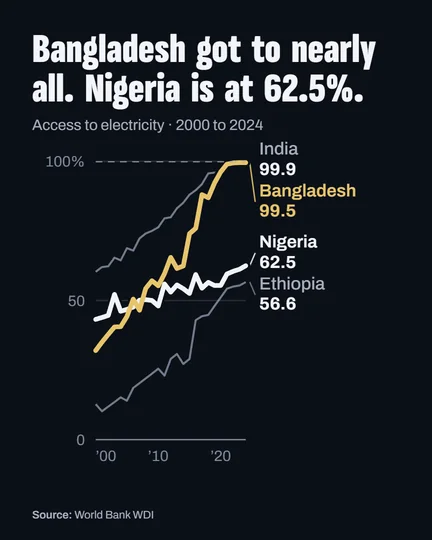
Yes. Pick several countries and each gets its own labelled line, or split them into a grid.
When do small multiples beat one chart?
When the lines cross so often that no country can be followed. One panel each lets every shape show.
Is it free?
Yes. The editor opens without an account; a free account saves and downloads. Free: charts, all 11 types, every built-in indicator, publish and embed, 10 saved pieces. PLUS adds race videos, background photos and your own images, high resolution and vector export; PRO adds 5 brand kits. Compare the plans