What you get
- Five classes, named cuts
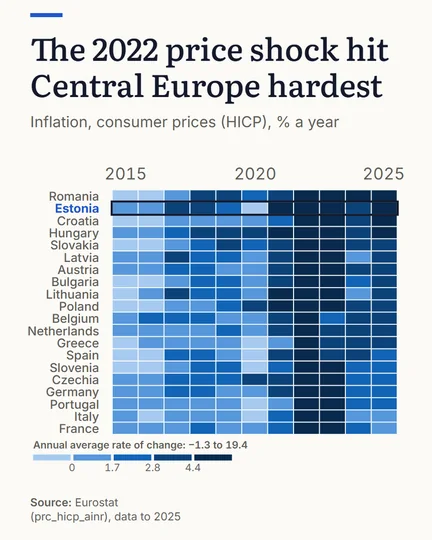
- GeoLens sorts the values into five classes on round breaks and names every cut in the key.
- Ranked rows
- Rank the rows high first or low first, so similar countries sit together and bands of colour form.
- Figures in the cells
- Where a cell has room, it prints its figure.
- Your colours
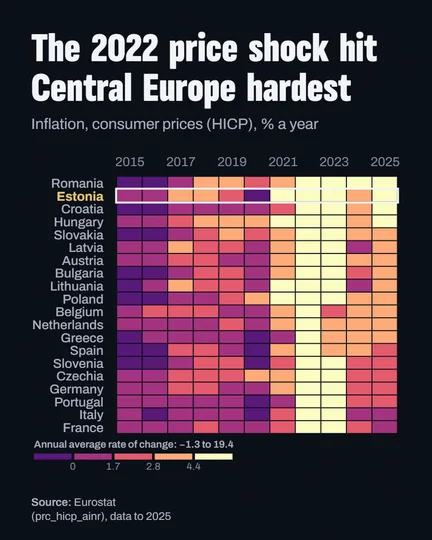
- Pick the ramp, break it on a log scale for values that span orders of magnitude, or reverse it.
Made here
Questions
What do I get from the heatmap maker?
A grid of countries by year, coloured from the built-in data, with a key that names every cut and the source printed under it.
When is a heatmap better than a line chart?
When there are too many countries for lines to stay apart: a row per country keeps each history readable, and the colour shows the pattern across all of them.
Is it free?
Yes. The editor opens without an account; a free account saves and downloads. Free: charts, all 11 types, every built-in indicator, publish and embed, 10 saved pieces. PLUS adds race videos, background photos and your own images, high resolution and vector export; PRO adds 5 brand kits. Compare the plans