What you get
- One year, your ramp
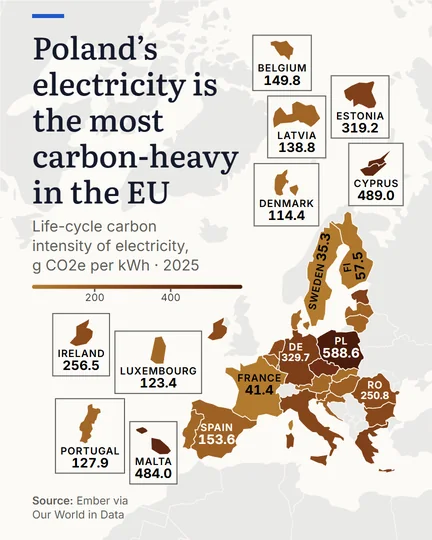
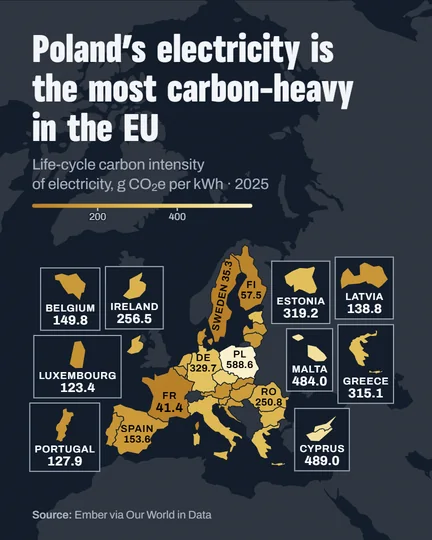
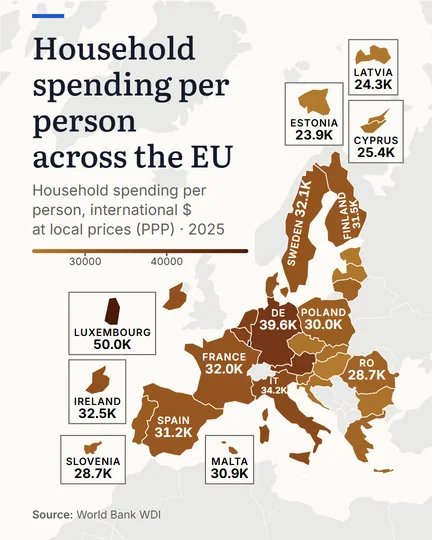
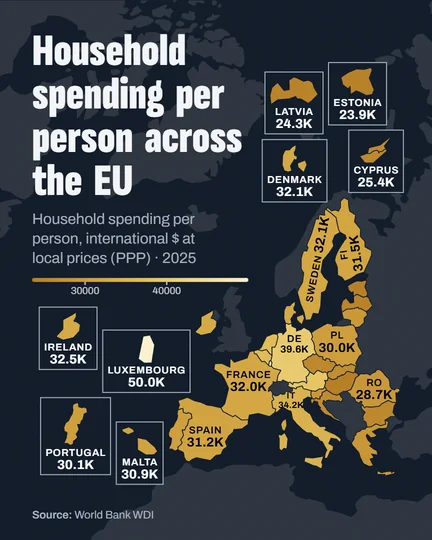
- A map shows one year at a time, in the colour ramp you choose, reversed end to end if you like.
- Your countries or the world
- Frame the countries you picked, or show the whole world.
- Values on the map
- Print each figure on its country, or names only. Small countries get a box with their value.
- One highlight
- The first country in the list wears the gold highlight.
Made here
Questions
Should I map a total or a rate?
Map a rate, a share or a per-person value. A raw total traces population, so the biggest countries always look darkest; divide first.
Which colour ramp should I choose?
One hue from light to dark for values that run from low to high; reverse the ramp when dark should mean good news.
I need a world map of CO2 emissions per person for a slide, where can I make one that cites the source?
Here: pick Greenhouse gas emissions, which counts CO2 with methane and nitrous oxide, set the values to per capita, and show the whole world. The map prints the source and the year under it.
Can I add a ranking beside the map?
Yes. Make a ranking bar chart of the same indicator and year, and post the two together.