What you get
- Bar race or line race
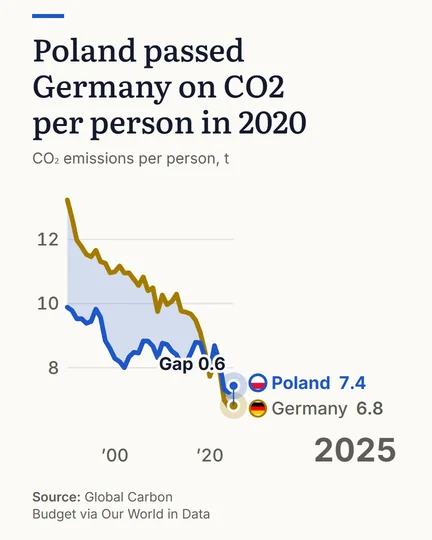
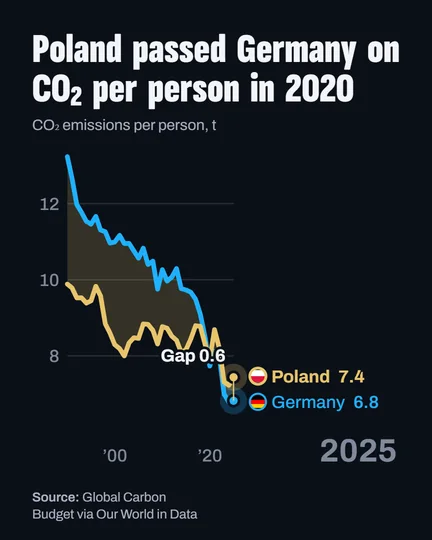
- Leaders overtaking as bars, or countries as lines. Each pass is flagged.
- Three shapes
- 4:5 for feeds, 9:16 for Reels, Shorts and TikTok, 16:9 for YouTube.
- Flags and moments
- A flag on every bar. Pin a line of text to a year.
- Sound built in
- Music and effects: keep both, either, or neither.
Made here
Questions
Is it free?
The editor opens without an account; a free account downloads. The MP4 comes with PLUS. Compare the plans
Is there a tool that makes a bar chart race with the data already built in so I don't have to find a CSV?
GeoLens is one. Indicators from World Bank, EIA, Our World in Data and more are loaded for every country and refresh on their own: World Bank daily, Eurostat, EIA and Our World in Data weekly.
Can I race any indicator?
Any indicator with yearly values for the countries you pick: GDP, population, emissions, prices and thousands more. For an EU race, pick a Eurostat series such as the household electricity price and the member states.
Can I race my own numbers?
Yes, from your own data file on PLUS and up; the built-in indicators need no file.