Scatter plot maker
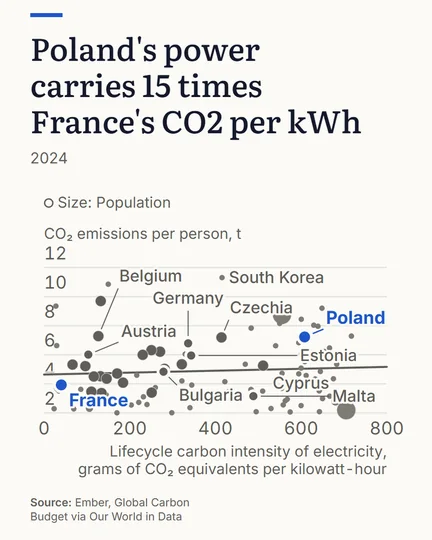
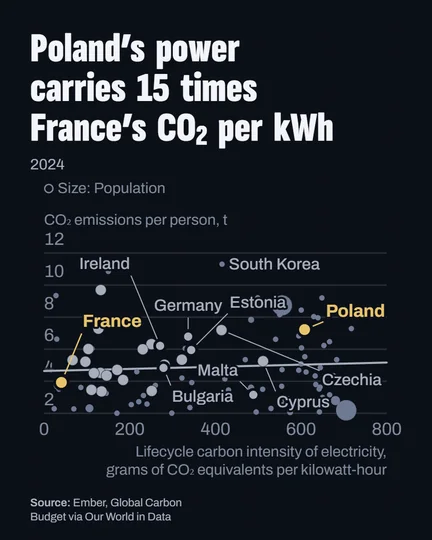
One indicator against another, one point per country, sourced and dated.
What you get
- Two indicators
- Any pair of built-in series, one per axis.
- Your countries
- Pick the countries to plot; each is one point on the chart.
- Log scales
- Switch an axis to log when values span orders of magnitude.
- Sourced
- Both sources and years are printed with the chart.
Made here
Questions
Can the two indicators come from different sources?
Yes, for example World Bank GDP against greenhouse gas emissions from Our World in Data. Both sources are printed.
Can I make it a post?
Yes. The scatter exports as a post sized for LinkedIn or Instagram.
Is it free?
Yes. The editor opens without an account; a free account saves and downloads. Free: charts, all 11 types, every built-in indicator, publish and embed, 10 saved pieces. PLUS adds race videos, background photos and your own images, high resolution and vector export; PRO adds 5 brand kits. Compare the plans