
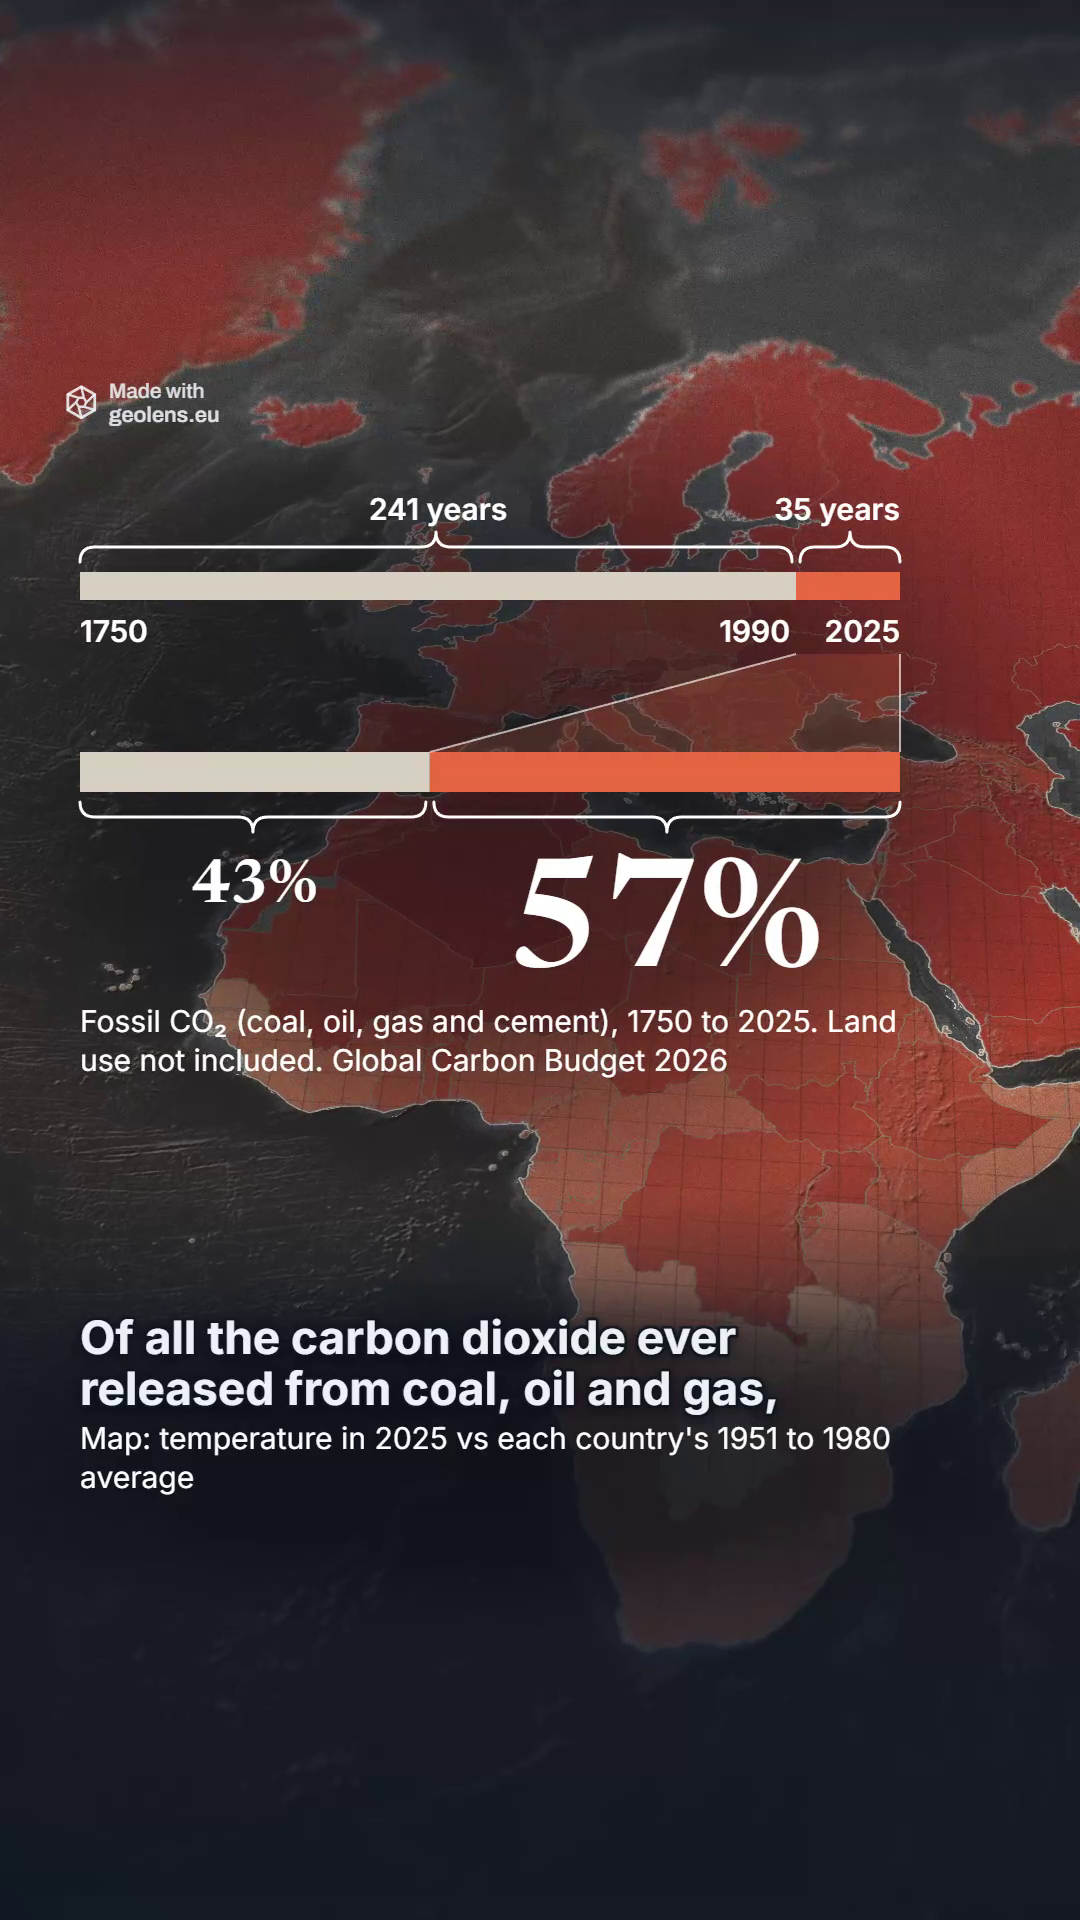
57% of all the carbon dioxide from fossil fuels went up after 1990
Who put it there, the US or China, depends on how you count.
Added up since 1750, the United States has emitted the most CO₂. Today China emits two and a half times as much as America, and per person the order changes again.
GeoLens team · 14 Nov 2026 · data to 2025
 Watch the film 1:05
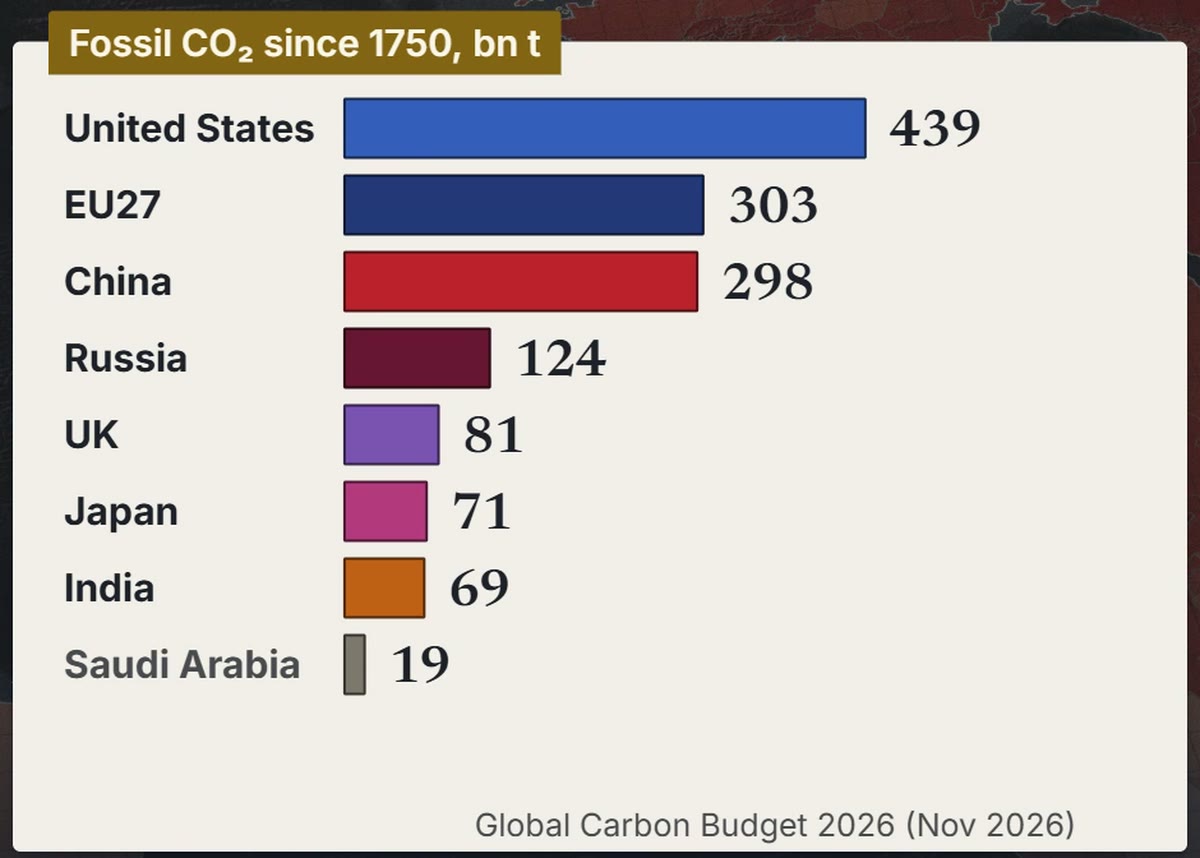
Since 1750 the US has emitted more than the whole EU27
Fossil CO₂ here means carbon dioxide from coal, oil, gas, cement and gas flaring, counted in the country where it is emitted. International flights and shipping count only in the world total, and CO₂ from clearing forests is left out.
From 1750 to 2025 the world released 1,887 billion tonnes of it, and 1,082 billion of that after 1990.
Add up every year and the United States comes first, with 439 billion tonnes, 23% of the total. By the end of 2025 the EU27, counted as one bloc, was second with 303, and China third with 298.
On the Global Carbon Project's 2026 projection, China passes the EU27 during 2026.
The numbers
| Figure | Value | Year | Source and release |
|---|---|---|---|
| World, fossil CO₂ added up | 1,887 bn t | 1750 to 2025 | Global Carbon Budget 2026 via OWID (Nov 2026) |
| World, of which after 1990 | 1,082 bn t (57%) | 1991 to 2025 | Global Carbon Budget 2026 via OWID (Nov 2026) |
| Coal, oil and gas alone, no cement or flaring, share after 1990 | 56.5% | 1991 to 2025 | GeoLens calc on Global Carbon Budget 2026 via OWID (Nov 2026) |
| United States, added up | 439 bn t (23%) | 1750 to 2025 | Global Carbon Budget 2026 via OWID (Nov 2026) |
| EU27 as one bloc, added up | 303 bn t | 1750 to 2025 | Global Carbon Budget 2026 via OWID (Nov 2026) |
| China, added up | 298 bn t | 1750 to 2025 | Global Carbon Budget 2026 via OWID (Nov 2026) |
| Russia, UK, Japan, India, added up | 124, 81, 71, 69 bn t | 1750 to 2025 | Global Carbon Budget 2026 via OWID (Nov 2026) |
| Saudi Arabia, added up (grey in the chart) | 19 bn t | 1750 to 2025 | Global Carbon Budget 2026 via OWID (Nov 2026) |
| China passes the EU27, projected | during 2026 | 2026 | GeoLens sum on the Global Carbon Project 2026 projection (10 Nov 2026) |
Source, unless a row names its own: Global Carbon Budget 2026 via OWID (Nov 2026)
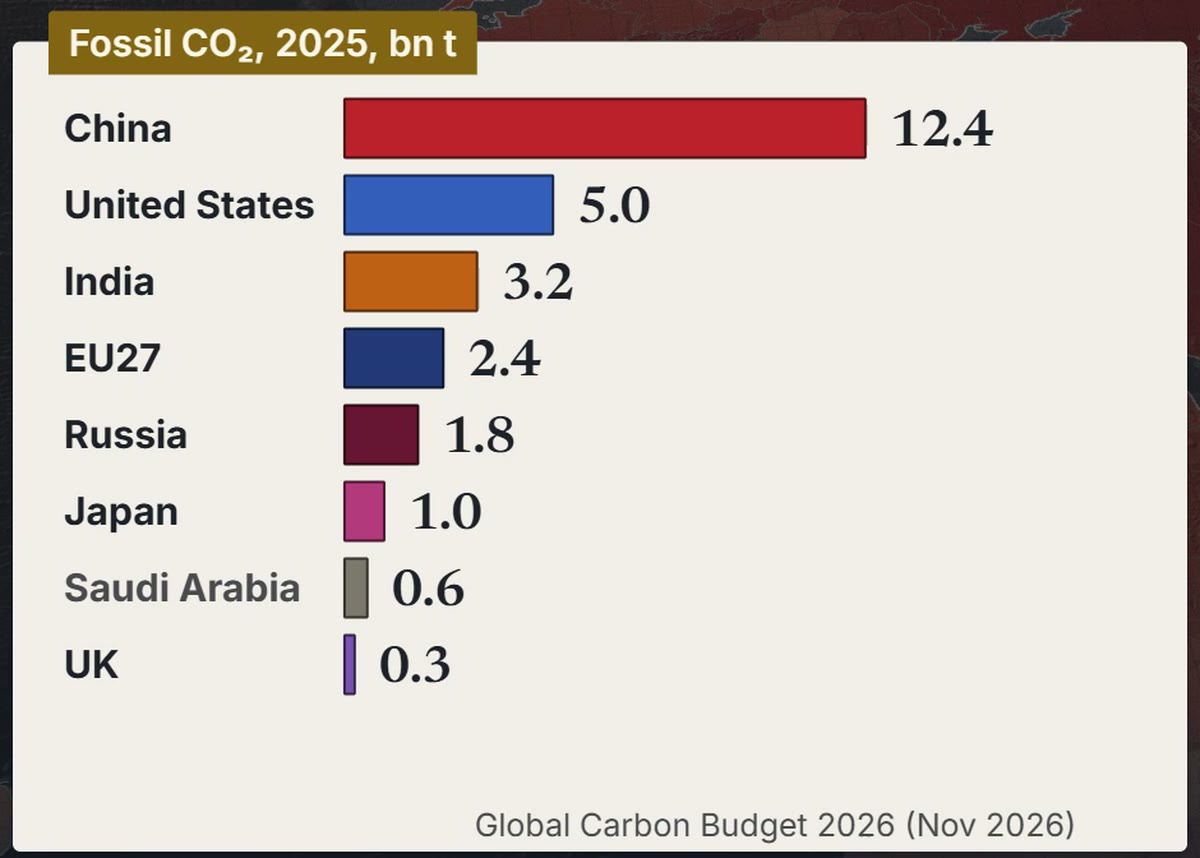
In 2025 China emitted more than the US, India and the EU27 together
One year tells another story. In 2025 China emitted 12.4 billion tonnes, two and a half times the US figure of 5.0.
India came third, with 3.2 billion tonnes, ahead of the EU27 bloc at 2.4.
The numbers
| Figure | Value | Year | Source and release |
|---|---|---|---|
| China | 12.4 bn t | 2025 | Global Carbon Budget 2026 via OWID (Nov 2026) |
| United States | 5.0 bn t | 2025 | Global Carbon Budget 2026 via OWID (Nov 2026) |
| China against the US | 2.5 times (2.47) | 2025 | GeoLens calc on Global Carbon Budget 2026 via OWID (Nov 2026) |
| India | 3.2 bn t | 2025 | Global Carbon Budget 2026 via OWID (Nov 2026) |
| EU27 as one bloc | 2.4 bn t | 2025 | Global Carbon Budget 2026 via OWID (Nov 2026) |
| US, India and EU27 together | 10.6 bn t | 2025 | GeoLens sum on Global Carbon Budget 2026 via OWID (Nov 2026) |
| Russia, Japan, Saudi Arabia, UK | 1.8, 1.0, 0.6, 0.3 bn t | 2025 | Global Carbon Budget 2026 via OWID (Nov 2026) |
Source, unless a row names its own: Global Carbon Budget 2026 via OWID (Nov 2026)
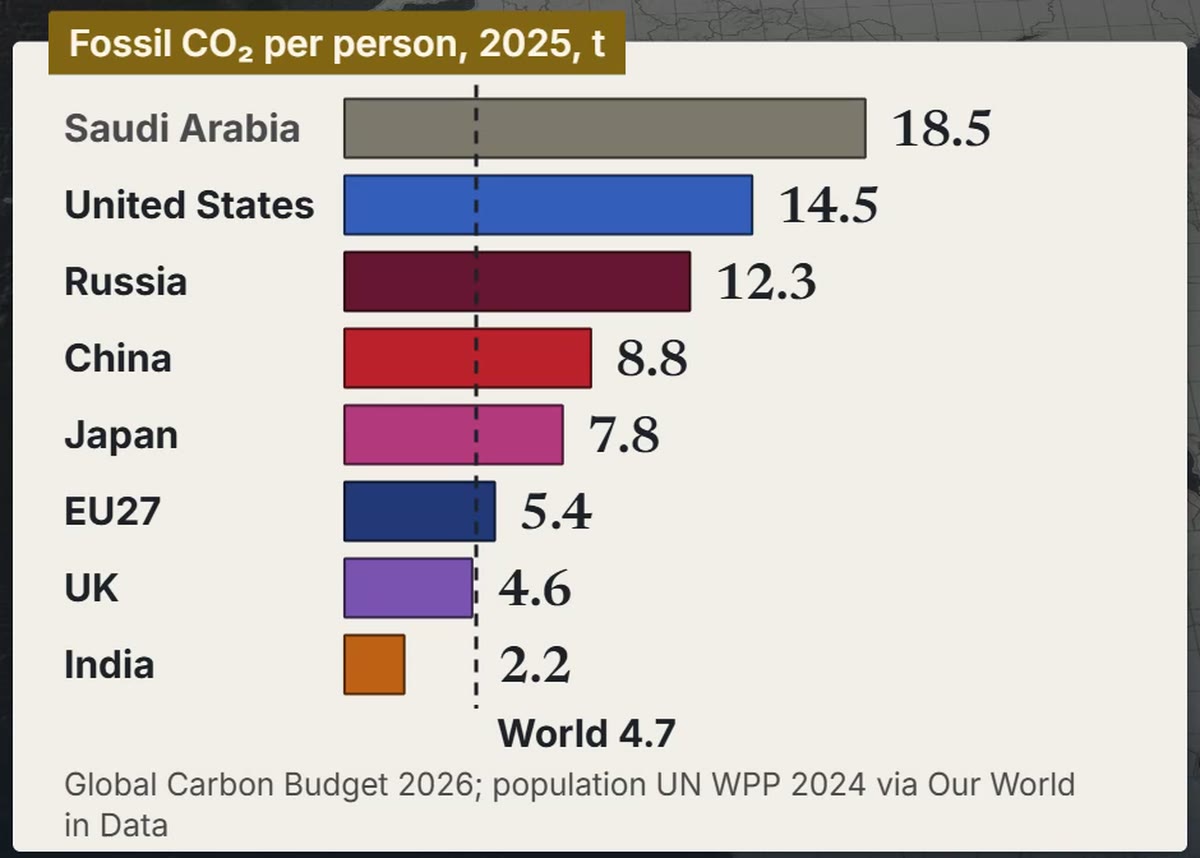
Per person, the US is ahead of China, and China is ahead of the EU27
China has four times as many people as the US. In 2025 the average American emitted 14.5 tonnes, a person in China 8.8 and a person in the EU27 5.4.
India, the most populous country, emitted 2.2 tonnes a head, under the world average of 4.7. Russia, at 12.3, sits between the US and China.
Peers are close. Australia (14.0) and Canada (13.6) are near the US; South Korea (11.2) and Japan (7.8) sit either side of China.
Inside the EU, Poland emits 7.4 tonnes a head, Germany 6.8 and France 3.8.
Line chart of CO₂ emissions per person from 1950 to 2025 for the United States, Russia, Japan, China, the EU27, India and the world. The US runs highest, peaking at 21.5 tonnes in 1973 and falling to 14.5 in 2025. China rises from 0.1 to 8.8 and passes the EU27 in 2013, as the EU27 falls from 10.2 in 1979 to 5.4. India reaches 2.2 and the world 4.7.
The numbers
| Figure | Value | Year | Source and release |
|---|---|---|---|
| Population, China and US | 1,416 m and 347 m | 2025 | UN WPP 2024 via OWID |
| Population, India | 1,464 m | 2025 | UN WPP 2024 via OWID |
| Per person: US, China, EU27 | 14.5, 8.8, 5.4 t | 2025 | Global Carbon Budget 2026; population UN WPP 2024; via OWID (Nov 2026) |
| Per person: India, Russia, World | 2.2, 12.3, 4.7 t | 2025 | Global Carbon Budget 2026; population UN WPP 2024; via OWID (Nov 2026) |
| Per person: UK, Japan | 4.6, 7.8 t | 2025 | Global Carbon Budget 2026; population UN WPP 2024; via OWID (Nov 2026) |
| Per person: Saudi Arabia (grey in the chart) | 18.5 t | 2025 | Global Carbon Budget 2026; population UN WPP 2024; via OWID (Nov 2026) |
| Per person: Australia, Canada, South Korea | 14.0, 13.6, 11.2 t | 2025 | Global Carbon Budget 2026; population UN WPP 2024; via OWID (Nov 2026) |
| Per person: Poland, Germany, France | 7.4, 6.8, 3.8 t | 2025 | Global Carbon Budget 2026; population UN WPP 2024; via OWID (Nov 2026) |
| China passes the EU27, per person | 7.3 against 7.2 t | 2013 | Global Carbon Budget 2026; population UN WPP 2024; via OWID (Nov 2026) |
| US per person, at its peak | 21.5 t | 1973 | Global Carbon Budget 2026; population UN WPP 2024; via OWID (Nov 2026) |
Source, unless a row names its own: Global Carbon Budget 2026; population UN WPP 2024; via OWID (Nov 2026)
In 2024 the world's yearly average passed 1.5 °C for the first time
The IPCC finds the human influence on the warming unequivocal.
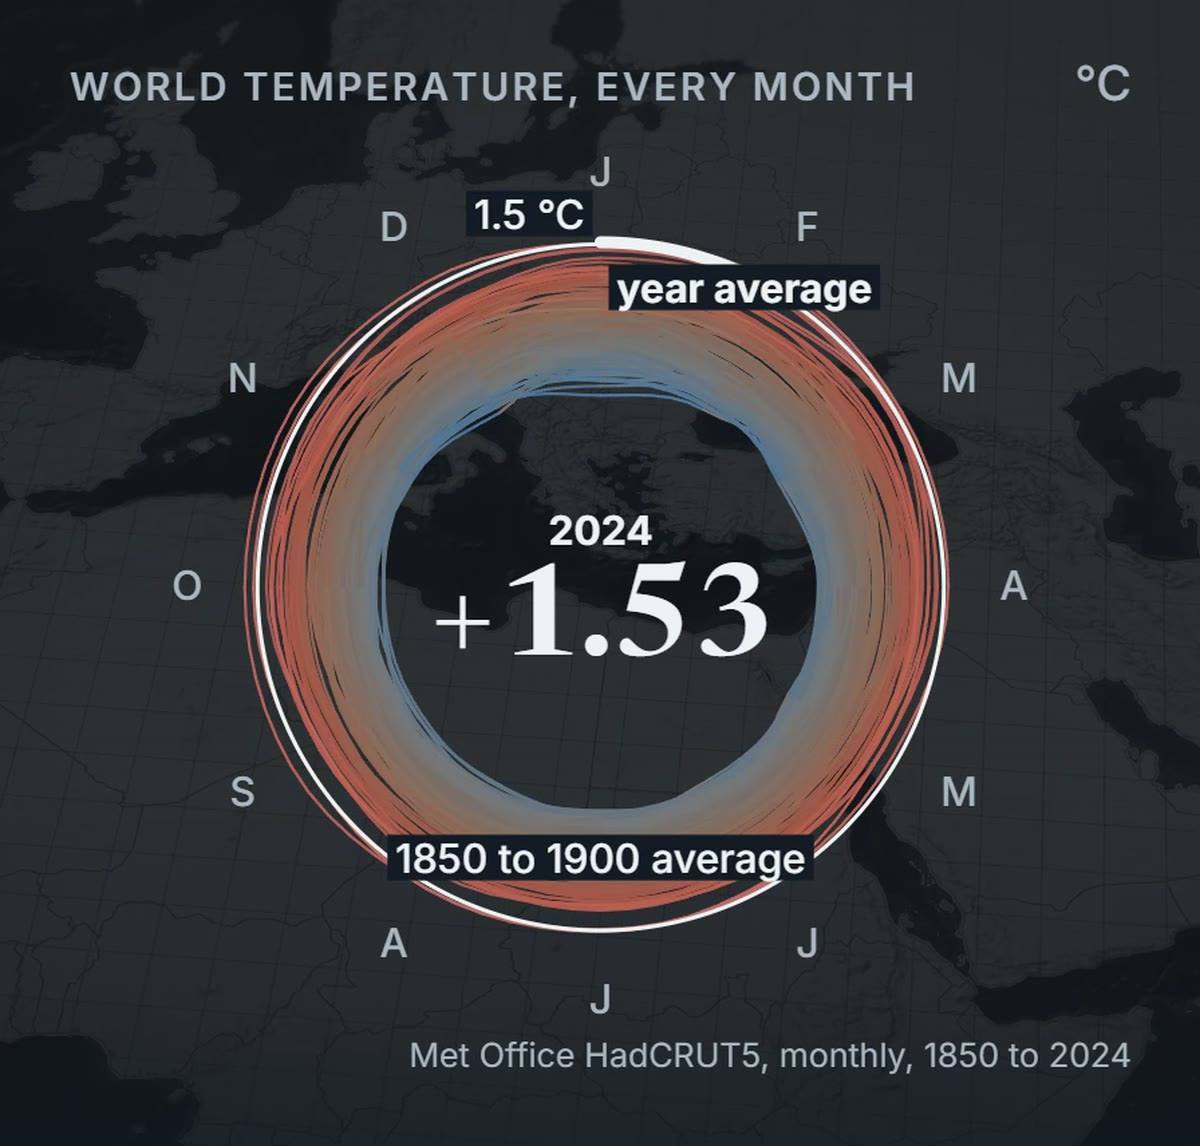
The spiral below draws world temperature month by month since 1850. It measures each month against the 1850 to 1900 average, which the IPCC uses for the years before industry.
The Met Office puts the 2024 average at 1.53 °C above 1850 to 1900, Copernicus at 1.60 and the WMO at 1.55.
NASA (1.47) and NOAA (1.46) put it just under. The WMO, averaging six datasets, calls 2024 likely the first year past 1.5 °C.
Not every month was past the line: in the Met Office series, May, June, July and December 2024 stayed under it.
Nor does one year break the Paris Agreement's 1.5 °C goal: the IPCC measures warming as a 20-year average.
The numbers
| Figure | Value | Year | Source and release |
|---|---|---|---|
| Human influence on the warming | unequivocal | 2021 | IPCC AR6 WG1, SPM (2021) |
| World against 1850 to 1900, Met Office | +1.53 °C (1.45 to 1.62) | 2024 | Met Office, HadCRUT5 (2025) |
| World against 1850 to 1900, Copernicus | +1.60 °C | 2024 | C3S Global Climate Highlights 2025 (Jan 2026) |
| World against 1850 to 1900, WMO | +1.55 °C (+/- 0.13) | 2024 | WMO State of the Global Climate 2024 (Mar 2025) |
| World against 1850 to 1900, NASA | +1.47 °C | 2024 | NASA GISS (Jan 2025) |
| World against 1850 to 1900, NOAA | +1.46 °C | 2024 | NOAA NCEI, Global Climate Report 2024 (Jan 2025) |
| Months under 1.5 °C, Met Office series | 4 of 12 (May, Jun, Jul, Dec) | 2024 | GeoLens calc, HadCRUT 5.1.0.0 (read 14 Nov 2026) |
| Months drawn in the spiral | Jan 1850 to Dec 2024 | 1850 to 2024 | Met Office HadCRUT 5.1.0.0 (read 14 Nov 2026) |
| Paris goal, measured as a 20-year average | 1.5 °C | goal 2015, measure 2021 | Paris Agreement (2015); IPCC AR6 WG1 (2021) |
Before 1800, CO₂ stayed under 300 ppm for 800,000 years. In 2025 it averaged 427
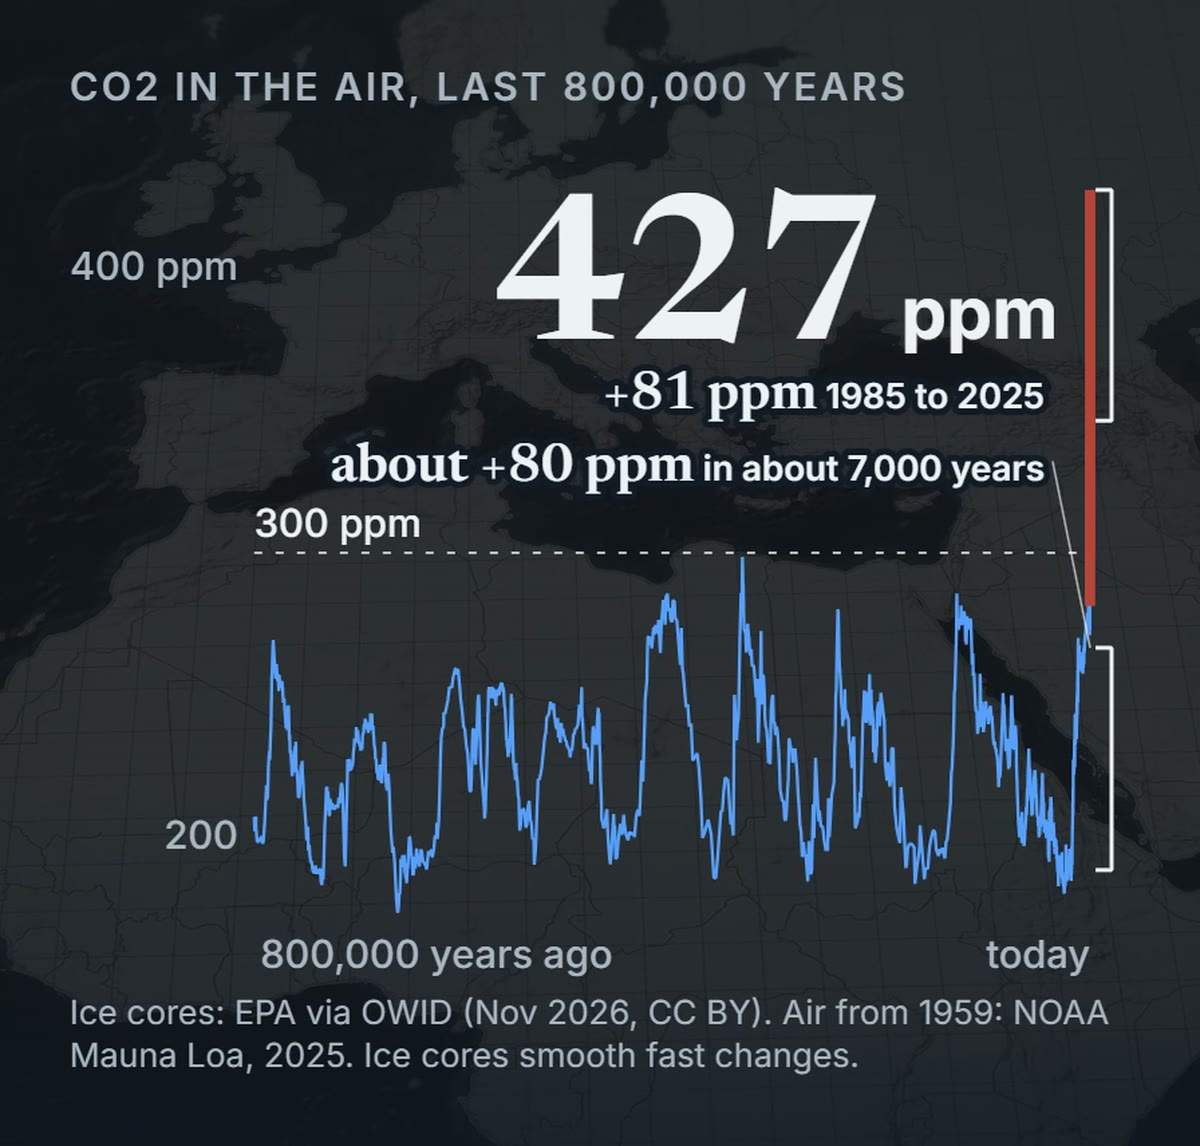
Air trapped in Antarctic ice holds 800,000 years of CO₂, rising and falling with the ice ages. Before 1800 it never passed 300 parts per million (ppm): the highest was 298.6, about 335,000 years ago.
In 1750, before industry, the air held 278 ppm. The 2025 average at Mauna Loa, Hawaii, 427 ppm, is 54% above that ice-core value.
The IPCC found the 2019 world average, 410 ppm, already the highest in at least 2 million years.
When the last ice age ended, CO₂ rose about 80 ppm in about 7,000 years. From 1985 to 2025 it rose 81 ppm, in 40 years.
Ice cores smooth fast changes, but the IPCC, allowing for that, finds CO₂ rose at least 10 times faster from 1900 to 2019 than at any other time in 800,000 years.
The numbers
| Figure | Value | Year | Source and release |
|---|---|---|---|
| Length of the ice-core record | about 800,000 years | 803,719 BCE to 1958 | EPA via Our World in Data (Nov 2026) |
| Highest CO₂ before 1800 | 298.6 ppm (+/- 3.0) | about 335,000 years ago | Bereiter et al. 2015 via EPA and OWID (Nov 2026) |
| CO₂ before industry | 278.3 ppm (+/- 2.9) | 1750 | IPCC AR6 WG1, ch. 2 (2021) |
| CO₂ in the air, Mauna Loa | 427.35 ppm | 2025 | NOAA Global Monitoring Laboratory (2026) |
| Mauna Loa 2025 against the 1750 ice-core value | +54% | 1750 to 2025 | GeoLens calc on NOAA GML (2026) and IPCC AR6 (2021) |
| CO₂ in 2019, world average, highest in at least | 2 million years (410 ppm) | 2019 | IPCC AR6 WG1, SPM A.2.1 (2021) |
| Rise at the end of the last ice age | about +80 ppm (+76.5) in about 7,000 years | about 18,000 to 11,000 years ago | Bereiter et al. 2015 (NOAA NCEI) |
| Rise at Mauna Loa | +81 ppm (346.35 to 427.35) | 1985 to 2025 | NOAA Global Monitoring Laboratory (2026) |
| CO₂ rate against any other time in 800,000 years | at least 10 times faster | 1900 to 2019 | IPCC AR6 WG1, ch. 5 (2021) |
Source, unless a row names its own: NOAA Global Monitoring Laboratory (2026)
In 2024 all 187 countries and territories in the data ran warmer than their 1951 to 1980 average
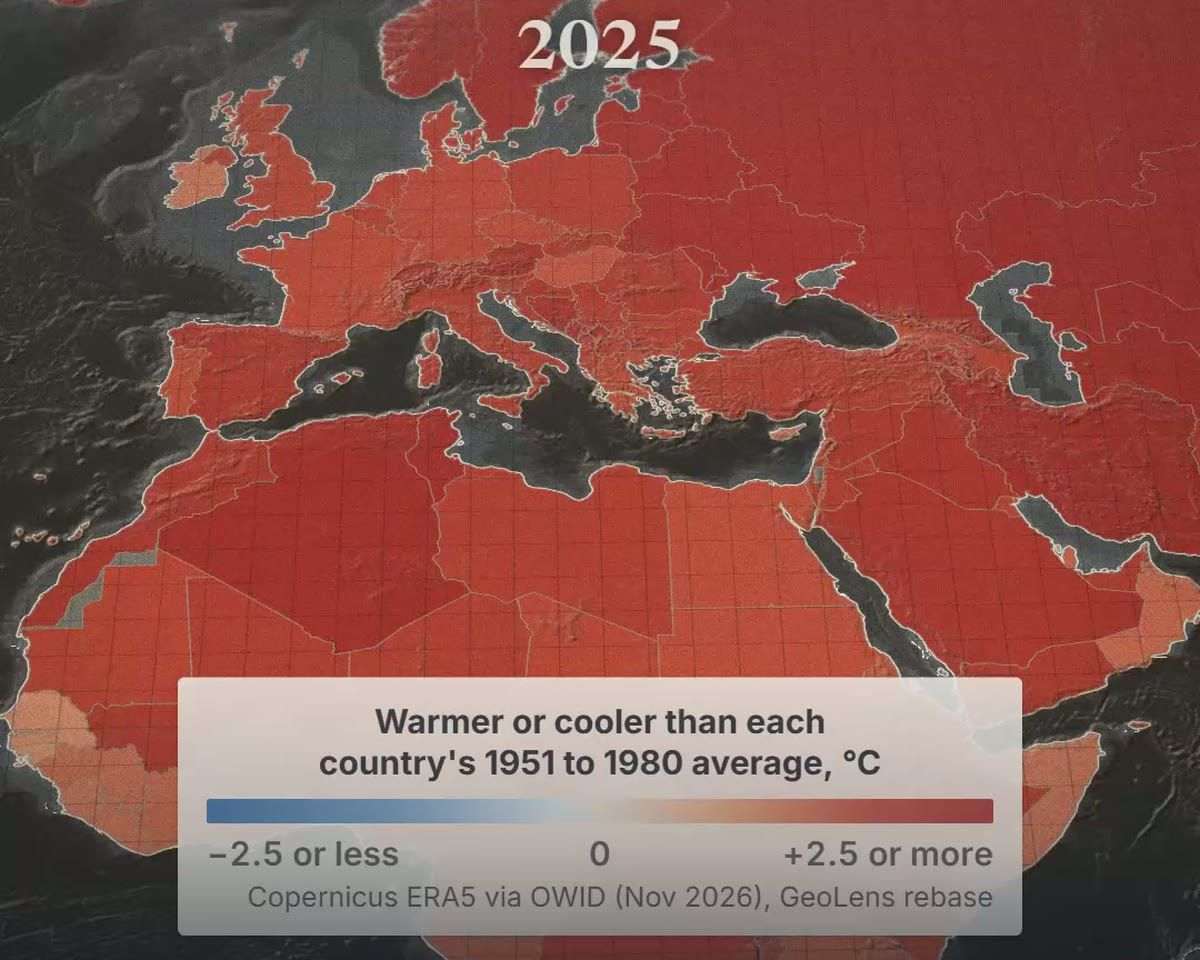
The film's map colours each country and territory by how far its year ran from its own 1951 to 1980 average, in Copernicus ERA5 data that start in 1940. In 1944, 59% were cooler than that average; by 2000, 9% were.
In 2024, 93% were at least 1 °C warmer. In 2025, 78% were.
The coolest in 2024, Uruguay, still ran 0.46 °C above its average.
Copernicus and the WMO name Europe the fastest-warming continent, at about twice the global average. One hot year can be luck.
Decades of red are not.
Heatmap of yearly temperature against each country's own 1991 to 2020 average from 1940 to 2025, one row each for the world and 16 countries, the world outlined, blue cooler and red warmer. The rows run mostly blue until the 1980s and turn red from the 2000s; from 2015 to 2025, 95% of the cells are red.
The numbers
| Figure | Value | Year | Source and release |
|---|---|---|---|
| Countries and territories in the data | 187 | 1940 to 2025 | Copernicus ERA5 via OWID (Nov 2026) |
| Cooler than their 1951 to 1980 average | 59% | 1944 | GeoLens calc, Copernicus ERA5 via OWID (Nov 2026) |
| Cooler than it | 9% | 2000 | GeoLens calc, Copernicus ERA5 via OWID (Nov 2026) |
| 1 °C or more above it | 93% | 2024 | GeoLens calc, Copernicus ERA5 via OWID (Nov 2026) |
| 1 °C or more above it | 78% | 2025 | GeoLens calc, Copernicus ERA5 via OWID (Nov 2026) |
| Cooler than it | none | 2024 | GeoLens calc, Copernicus ERA5 via OWID (Nov 2026) |
| Coolest, Uruguay | +0.46 °C | 2024 | GeoLens calc, Copernicus ERA5 via OWID (Nov 2026) |
| Europe's warming against the global average | about 2 times | 1980s to 2025 | C3S and WMO, European State of the Climate 2025 (Apr 2026) |
| Years warmer than their 1991 to 2020 average, world and 16 countries (the chart) | 2% | 1940 to 1979 | GeoLens calc, Copernicus ERA5 via OWID (Nov 2026) |
| The same, recent years | 95% | 2015 to 2025 | GeoLens calc, Copernicus ERA5 via OWID (Nov 2026) |
Source, unless a row names its own: GeoLens calc, Copernicus ERA5 via OWID (Nov 2026)
What people ask about the count
Isn't China worse? In one year, yes: in 2025 China emitted 32% of the world's fossil CO₂.
Added up since 1750, the US has emitted more. Per person, an American still emits more than a person in China.
Is the US the worst per person? No.
Eleven places emit more per head, led by Qatar at 31.5 tonnes in 2025. Most of them are small oil and gas states.
Among countries of more than 10 million people, the US is fourth, after the United Arab Emirates, Saudi Arabia and Kazakhstan.
Isn't 1990 cherry-picked? Pick another start and it holds: 69% went up since 1980, and the halfway mark fell in 1996.
Count CO₂ from clearing forests too (that series starts in 1850), and the halfway mark moves back to 1987.
The chart below shows why: yearly emissions have climbed steeply since 1950.
Line chart of the world's CO₂ emissions from fossil fuels and industry, 1850 to 2025. The line is near zero in 1850 at 0.2 billion tonnes, climbs slowly to 5.9 billion in 1950, then steeply, and reaches 39.0 billion tonnes in 2025.
The numbers
| Figure | Value | Year | Source and release |
|---|---|---|---|
| China's share of world fossil CO₂ | 32% | 2025 | Global Carbon Budget 2026 via OWID (Nov 2026) |
| Places above the US per person | 11 | 2025 | Global Carbon Budget 2026; population UN WPP 2024; via OWID (Nov 2026) |
| Qatar, per person | 31.5 t | 2025 | Global Carbon Budget 2026; population UN WPP 2024; via OWID (Nov 2026) |
| US rank per person, countries over 10 million people | 4th | 2025 | Global Carbon Budget 2026; population UN WPP 2024; via OWID (Nov 2026) |
| Share of all fossil CO₂ that went up since 1980 | 69% | 1980 to 2025 | GeoLens calc on Global Carbon Budget 2026 via OWID (Nov 2026) |
| Halfway mark of all fossil CO₂ | during 1996 | 1750 to 2025 | GeoLens calc on Global Carbon Budget 2026 via OWID (Nov 2026) |
| Halfway mark, land use included | during 1987 | 1850 to 2025 | GeoLens calc on Global Carbon Budget 2026 incl. land use via OWID (Nov 2026) |
| World, fossil CO₂ (the chart) | 0.2, 5.9, 39.0 bn t | 1850, 1950, 2025 | Global Carbon Budget 2026 via OWID (Nov 2026) |
Source, unless a row names its own: Global Carbon Budget 2026; population UN WPP 2024; via OWID (Nov 2026)
What people ask about the warming
Was 2024 just one El Niño year? One year could be.
But 2023 to 2025 together averaged 1.52 °C above 1850 to 1900, the first three-year average past 1.5 °C (Copernicus).
Why more than one baseline? The map compares each country with its own 1951 to 1980 average; the 1.5 °C compares the world with 1850 to 1900.
The chart below uses the 1991 to 2020 average that Copernicus publishes, 0.88 °C warmer than 1850 to 1900. Even on that harder test, only Iceland ran cooler in 2024.
Bar chart of 2024 temperature against each country's own 1991 to 2020 average for 20 countries, with the world as the reference row at +0.72 °C and a dashed rule at that value. Every bar is above zero, from Ukraine at +2.39 °C to India at +0.57 °C.
The numbers
| Figure | Value | Year | Source and release |
|---|---|---|---|
| World, three-year average, against 1850 to 1900 | +1.52 °C | 2023 to 2025 | C3S Global Climate Highlights 2025 (Jan 2026) |
| 1991 to 2020 against 1850 to 1900 | +0.88 °C | ERA5, as of Jan 2026 | C3S Global Climate Highlights 2025 (Jan 2026) |
| Only country cooler than its 1991 to 2020 average, Iceland | -0.96 °C | 2024 | GeoLens calc, Copernicus ERA5 via OWID (Nov 2026) |
| World against its 1991 to 2020 average (the chart) | +0.72 °C | 2024 | Copernicus ERA5 via OWID (Nov 2026) |
Source, unless a row names its own: C3S Global Climate Highlights 2025 (Jan 2026)
What people ask about the ice cores
Is it just a natural cycle? The ice-age cycles are real but slow: Earth's orbit paces them over tens of thousands of years, and the next natural ice age is at least 10,000 years away.
The IPCC finds natural drivers, the Sun and volcanoes included, moved global temperature by -0.1 to +0.1 °C between 1850 to 1900 and 2010 to 2019.
Did you glue Mauna Loa onto the ice cores? The ice-core record runs to 1958 and the air measurements at Mauna Loa start in 1959.
At the join they agree: 315.3 ppm in the ice, 316.0 in the air. The film's ice line stops at 1799; in the ice, CO₂ first passes 300 ppm in 1909.
The numbers
| Figure | Value | Year | Source and release |
|---|---|---|---|
| Next natural ice age, at the earliest | about 10,000 years away | from today | IPCC AR5 WG1 (2013); Ganopolski et al. 2016; Barker et al. 2025 |
| Natural drivers, effect on global temperature | -0.1 to +0.1 °C | 1850-1900 to 2010-2019 | IPCC AR6 WG1, SPM A.1.3 (2021) |
| CO₂ in the ice cores at the join | 315.3 ppm | 1958 | EPA via Our World in Data (Nov 2026) |
| CO₂ in the air at the join, Mauna Loa | 316.0 ppm | 1959 | NOAA Global Monitoring Laboratory (2026) |
| First year above 300 ppm in the ice | 1909 (301.5 ppm) | 1909 | EPA via Our World in Data (Nov 2026) |
Source, unless a row names its own: EPA via Our World in Data (Nov 2026)